Introduction
Wind drives revenue at a wind farm. It also drives the most serious operational risks. A single lightning strike can take a turbine offline for weeks. Ice accumulation on blades steadily erodes annual energy production by 10–25% at cold-climate sites. And because turbine output scales with the cube of wind speed, even a 2% error in wind measurement translates to meaningful forecasting inaccuracies and lost revenue.
For operators, weather monitoring is the operational foundation on which curtailment decisions, maintenance scheduling, personnel safety, and grid compliance all depend.
This guide covers:
- The weather parameters that matter most for turbine performance and safety
- Sensor technologies used to measure them accurately
- Trade-offs between met masts and remote sensing approaches
- Practical challenges operators face onshore and offshore
Key Takeaways
- Wind speed, direction, turbulence intensity, precipitation type, icing conditions, temperature, and lightning proximity are the essential parameters to track.
- Turbine output scales with the cube of wind speed — small measurement errors have outsized financial consequences.
- Met masts deliver high-accuracy in-situ data at hub height.
- LiDAR and SoDAR extend vertical wind profiles without the cost of tall infrastructure.
- Choose sensors with built-in self-diagnostics — remote wind farm sites leave little room for unplanned maintenance.
Why Weather Monitoring Is Critical for Wind Farm Operations
The Revenue Connection
Turbine power output is proportional to the cube of wind speed. At hub heights now ranging from 105 to 167 meters on modern utility turbines, surface-level readings are useless for accurate power forecasting — and forecast errors compound quickly into measurable financial loss.
The financial stakes at the grid level are significant. A 2024 LBNL/NREL study found that forecast-error reserve costs for combined solar and wind generation range from $0.09B to $1.24B per year across modeled multi-utility regions — equivalent to $0.12–$1.68 per MWh of load.
Better forecasting has a proven dollar value. The NOAA/DOE Wind Forecast Improvement Project (WFIP) reduced power forecast error by approximately 12% to 5% across the first 12 forecast hours. According to the DOE, the resulting improvements to NOAA's HRRR weather model saved utilities more than $95M per year.
Safety and Asset Protection
The financial case for weather monitoring is inseparable from the safety case. Real-time data enables the decisions that protect both people and equipment:
- Personnel safety — thunderstorms, high winds, and icing require pausing maintenance, evacuating crews, or delaying vessel access before conditions deteriorate.
- Lightning damage — according to DNV, lightning is the single largest cause of unplanned downtime in wind turbines and the most common insurance claim filed by wind farm owners. Tall, isolated turbines are effective lightning rods. Proximity alerting gives operators time to protect control systems and minimize post-strike downtime.
- Icing — IEA Wind Task 19 data shows IEA Icing Class 4 sites can generate approximately 4,000 ice pieces per turbine per year, creating both a production loss and a direct safety hazard through ice throw.
Regulatory and Compliance Obligations
Many grid operators mandate meteorological data telemetry. Two key requirements currently in effect or approaching:
- CAISO Appendix Q (effective November 1, 2023) — requires wind generators to transmit wind speed, air temperature, and barometric pressure every 4 seconds in real time.
- NERC GADS Wind (mandatory from January 1, 2026) — applies to wind plants with 75 MW or greater installed capacity.
Documented, high-quality weather data supports both compliance and power purchase agreement obligations.
Key Weather Parameters Wind Farms Must Monitor
Wind Parameters: The Foundation of Turbine Performance
Wind parameters form the core of any turbine monitoring system. Each one maps directly to a control action, a load calculation, or a production forecast.
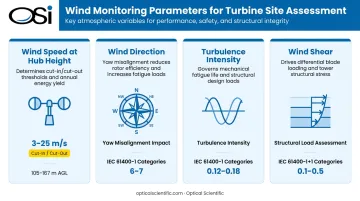
- Wind speed at hub height — the single most critical measurement. Turbines cut in near 3 m/s and cut out around 22.5–25 m/s, thresholds that must be evaluated at operating altitude, not ground level. Hub heights on current GE Vernova and Vestas machines range from 105 to 167 meters AGL.
- Wind direction drives yaw control. Turbines must continuously face into the wind to maximize energy capture; directional measurement errors cause misalignment, reducing output and increasing rotor loading.
- Turbulence intensity (TI) measures the ratio of wind speed standard deviation to mean wind speed. High turbulence accelerates blade and drivetrain fatigue. The IEC 61400-1 standard defines turbulence categories with reference intensity values from 0.12 (Category C) to 0.18 (Category A+).
- Wind shear describes how speed varies with altitude. It affects both energy production modeling and structural load calculations across the full rotor swept area.
Precipitation, Icing, and Visibility
Ice accumulation on blades increases weight, degrades aerodynamic profiles, and can reduce annual energy production by 10–25% at high-icing-class sites. Early detection depends on monitoring precipitation type alongside temperature because freezing rain behaves very differently from snow. Identifying that transition matters for both production decisions and safety responses.
Visibility monitoring supports safe maintenance access, particularly for helicopter operations at offshore sites. Present weather sensors that automatically classify precipitation type (distinguishing freezing drizzle from rain, sleet from snow) provide the specificity needed for timely operational decisions.
Severe Weather and Atmospheric Variables
Lightning monitoring deserves its own category given the asset risk. Tower height and geographic isolation make turbines highly vulnerable. Real-time proximity alerting lets operators take protective action before a strike, not just respond after.
Temperature, humidity, and barometric pressure support air density corrections that affect power output calculations, set icing risk thresholds, and feed numerical weather prediction models. CAISO requires temperature and pressure telemetry at 4-second intervals for regulatory compliance, making these parameters mandatory, not optional.
Weather Monitoring Equipment and Sensors
Anemometers: Cup and Ultrasonic
Cup anemometers remain the traditional standard for met mast installations. MEASNET's calibration practice, aligned with IEC 61400-12-1, covers the 4–16 m/s range that accounts for approximately 95% of annual energy production for typical turbines. That said, tower shadow effects, icing-related under-speeding, and dynamic over-speeding in gusts introduce systematic errors that must be documented and managed.
Ultrasonic (sonic) anemometers measure three-dimensional wind vectors with no moving parts and faster response times than cup designs. They're particularly well-suited for turbulence measurement. Trade-offs include higher cost and sensitivity to precipitation contamination affecting signal quality.
Present Weather and Precipitation Sensors
Optical present weather sensors detect precipitation type and intensity — the combination needed to flag icing risk early. For wind farm environments, where maintenance access is infrequent and costly, sensor design matters as much as sensor accuracy.
OSI's OWI-430 and APG-815 sensors are specifically designed for these demands. The OWI-430 uses three sensing technologies simultaneously: in-beam optical scintillation, off-axis forward scattering, and optional acoustic detection via the HIP-100 add-on.
Together, these discriminate between rain, snow, freezing rain, freezing drizzle, sleet, and ice pellets, reporting over 60 NWS/WMO weather codes.
Key specifications relevant to wind farm deployment:
- Operating temperature range: -50°C to 60°C
- MTBF: exceeds 80,000 hours
- No moving parts, no scheduled optical cleaning required
- Automatic Gain Control compensates for signal loss without manual intervention
- Power: nominal 12 VDC / max 400 mA — solar compatible
- Communications: RS-232, RS-485, Ethernet, MODBUS RTU, cellular modem options for SCADA integration
- Self-diagnostics update every minute and report potential problems automatically
The sensors have been validated in demanding offshore environments, including deployments on NOAA data buoys and in the North Atlantic on 3-meter discus buoys. That operational history — over 800 million accumulated field hours — is embedded in the adaptive algorithms, allowing the OWI-430 to maintain reported accuracy even when optics are partially contaminated by precipitation or salt spray.
Lightning Detection and SCADA Integration
Precipitation sensors address icing risk; lightning detection covers a separate but equally critical hazard. Systems range from point-of-use strike sensors to networked data services providing cloud-to-ground and intra-cloud strike data with peak current, polarity, and proximity alerting. Multi-site operators benefit from a unified lightning monitoring system that enforces consistent alerting parameters across all locations.
Weather sensor data must flow into the farm's SCADA system with accurate timestamps for real-time decisions, post-event analysis, and compliance reporting. At remote sites, cellular or satellite communication links are typically required to maintain continuous data transmission.
Met Masts vs. Remote Sensing Solutions
Met Masts
Met masts are instrumented lattice towers — typically equipped at multiple heights with anemometers, wind vanes, temperature sensors, and humidity probes. They provide continuous, direct in-situ measurements at hub height, which is why they remain the industry standard for bankable wind resource assessment.
Cost scales significantly with height and instrumentation. A 2010 NYSERDA benchmark put an 80-meter lattice tower at approximately $170,000–$190,000 including equipment, installation, and two years of operation. Current costs run higher, and offshore or complex-terrain installations add substantially to that figure.
LiDAR and SoDAR
Where met mast costs or logistics are prohibitive, remote sensing offers a practical alternative — no tall tower required:
- LiDAR uses laser pulses to measure wind speed at multiple altitudes above hub height
- SoDAR uses acoustic pulses to profile the wind column
Both can be deployed and relocated more easily than a permanent met mast. However, accuracy degrades in complex terrain. IEA Wind Task 32 data shows LiDAR agreement shifting from near-perfect in flat terrain (regression slope 0.9995) to a notably degraded fit in complex terrain (slope 0.8753), a meaningful difference for energy yield calculations.
Hybrid Approaches
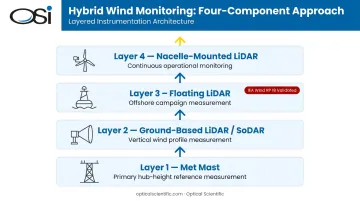
Most modern wind farms use both. Most deployments follow this pattern:
- Met mast for primary hub-height reference measurements and bankable data
- Ground-based LiDAR or SoDAR to capture full vertical wind profiles, especially during pre-construction assessment
- Floating LiDAR for offshore campaigns — validated to IEA Wind RP 18 best-practice KPIs (wind speed regression slope 0.98–1.02, R² >0.98)
- Nacelle-mounted LiDAR as an emerging option for continuous operational monitoring post-construction
Overcoming Key Wind Farm Monitoring Challenges
Radar Interference
Wind turbine blades create clutter on NEXRAD Doppler weather radar. NOAA's Radar Operations Center reports that 9% of analyzed wind farm proposals were within 10 miles (18 km) of a NEXRAD site — a proximity range where interference impacts increase significantly. The interference runs both directions: radar energy can also affect turbine electronics.
Developers can reduce permitting friction by addressing radar impacts early:
- Engage NOAA's Radar Operations Center during siting, before formal permitting begins
- Use DOE's public radar-siting tool to screen line-of-sight impacts as a first-pass filter
- Treat tool outputs as preliminary screening, not a final regulatory determination
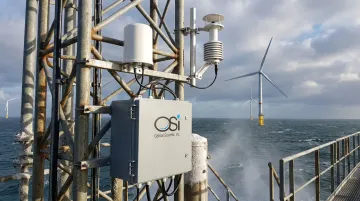
Sensor Reliability in Harsh Environments
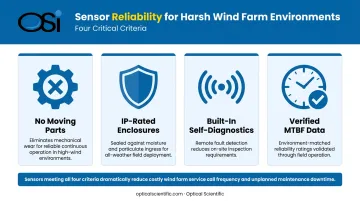
Offshore and exposed onshore sites subject instruments to salt spray, icing, high winds, and temperature extremes. Sensor selection criteria should prioritize:
- No-moving-parts designs to eliminate mechanical wear
- IP-rated enclosures for moisture and particulate protection
- Built-in self-diagnostics to enable remote fault detection without a site visit
- Verified MTBF data matched to the target environment
Every unplanned technician deployment to a remote or offshore site costs multiples of the sensor's annual operating cost. At scale, self-diagnosing, low-maintenance instruments pay for themselves through avoided service calls alone.
Offshore-Specific Complexity
Met mast installation in deep water is expensive and impractical beyond relatively shallow depths — which means offshore projects rely more heavily on alternative monitoring approaches:
- Met masts are still viable in shallow-water zones but quickly become cost-prohibitive as depth increases
- Floating LiDAR fills the gap but requires documented validation against IEA/Carbon Trust maturity standards before data can support investment decisions
- Metocean buoys extend monitoring to wave height and current data, operationally critical for scheduling vessel access
- Hyper-local forecasting is essential: maintenance windows offshore are narrow, and weather windows can close quickly
Frequently Asked Questions
How much does a met mast cost?
Cost varies considerably with tower height, instrumentation, site access, and whether the mast is temporary or permanent. A 2010 NYSERDA benchmark placed an 80-meter instrumented lattice tower at roughly $170,000–$190,000 including two years of operation. Current costs for tall towers in challenging terrain or offshore environments can run two to three times that figure.
How accurate is an anemometer?
Cup anemometers typically achieve ±1–3% accuracy under calibrated conditions across the 4–16 m/s range. In the field, performance is affected by tower shadow, icing, and dynamic over-speeding. Ultrasonic anemometers eliminate mechanical wear and measure 3D wind vectors, but cost more and can be sensitive to precipitation interference.
What weather parameters are most important to monitor at a wind farm?
Wind speed at hub height, wind direction, and turbulence intensity are the core performance parameters. For safety and asset protection, add precipitation type (for icing detection), temperature, and lightning proximity. Barometric pressure and humidity support air density corrections and regulatory telemetry requirements.
What is the difference between a met mast and remote sensing for wind measurement?
Met masts provide direct in-situ measurements at fixed heights, which makes them the industry standard for bankable data. LiDAR and SoDAR remotely sense wind profiles across a range of altitudes without a physical tower. Met masts carry higher installation costs but deliver greater data confidence; remote sensing trades some accuracy in complex terrain for deployment flexibility.
How does weather monitoring improve wind turbine performance and energy output?
Accurate real-time data enables better yaw control, earlier icing detection to prevent blade degradation, informed curtailment decisions, and improved power forecasting. At sites with high icing exposure or variable winds, these gains translate directly into a higher capacity factor.
What are the unique challenges of offshore wind farm weather monitoring?
Salt spray, humidity, and corrosion stress offshore equipment far harder than typical onshore conditions. Met masts are impractical in deep water, so floating LiDAR and metocean buoys take over — but both require rigorous validation. Coordinating maintenance vessel access around real-time wave height and wind forecasts adds an operational burden with no onshore equivalent.