Introduction
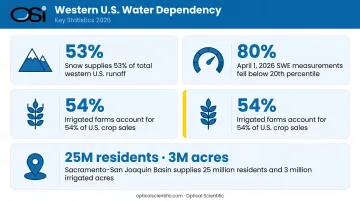
In the western United States, mountain snowpack functions as a natural reservoir — one that fills silently through winter and releases its contents through spring and summer when demand for water is highest. Research from Li et al. estimates that snow supplies 53% of total western U.S. runoff, rising to 70% in mountainous areas and accounting for roughly two-thirds of inflow to major western reservoirs. The scale of agriculture, municipal water supply, and hydropower generation riding on that snowpack is enormous.
The catch: snow depth alone tells you almost nothing useful about how much water is actually stored. Two snowpacks of identical depth can hold vastly different amounts of water depending on temperature history, storm type, and density. That gap between what you can see and what you need to know is exactly where Snow Water Equivalent (SWE) becomes indispensable.
This article covers:
- What SWE is and how it's calculated
- Why it matters for water management, agriculture, flood forecasting, and infrastructure safety
- What goes wrong when SWE data is missing or inaccurate
- How modern measurement programs work and where the technology is headed
Key Takeaways
- SWE measures the liquid water depth stored in a snowpack — not snow depth, but actual water content
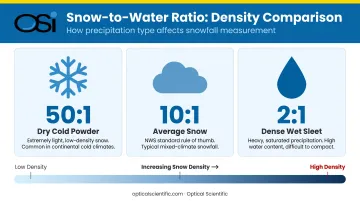
- Snow-to-water ratios range from 2:1 (dense sleet) to 50:1 (dry powder), making depth a poor proxy
- April 1 SWE is the primary benchmark for western water supply forecasting and allocation decisions
- Poor SWE data causes flood forecast errors, delayed drought declarations, and misallocated irrigation water
- Climate change is shrinking baseline SWE and shifting peak snowpack earlier — raising the stakes for accurate monitoring
What Is Snow Water Equivalent?
SWE is the depth of water that would cover the ground if an entire snowpack melted instantly. It's reported in inches or centimeters, and calculated as the product of snow depth and snow density. Density is what makes SWE so much more useful than snow depth alone.
Why Depth Misleads
According to the USDA Climate Hub, one inch of rain can produce anywhere from 2 inches of dense sleet to 50 or more inches of dry powder, depending on air temperature and storm characteristics. The National Weather Service uses a 10:1 rule of thumb — 10 inches of snow to 1 inch of water — but that ratio routinely falls outside that range in real conditions.
In practical terms: a mountain range holding 60 inches of cold, dry powder may store far less water than a range holding 40 inches of heavy, wet spring snow. If you're managing a reservoir or scheduling irrigation deliveries, that difference is the difference between an adequate water year and a shortage.
SWE as a Decision Variable
Water managers, flood forecasters, agricultural planners, and emergency responders all rely on SWE to make high-stakes decisions throughout winter and spring. The downstream applications that depend on it include:
- Reservoir storage targets and release timing
- Drought declarations and water allocation decisions
- Irrigation delivery schedules for agriculture
- Flood risk assessments and emergency preparedness
Each of these traces back to one question: how much liquid water does a given snowpack actually hold.
Key Applications of SWE: Why It Matters in Practice
Water Supply Planning and Drought Management
In snowmelt-dependent basins, reservoirs and irrigation systems are planned around projected spring runoff. The critical planning benchmark is April 1 SWE — the date when mountain snowpack historically approaches its seasonal peak and provides the most reliable signal for summer water availability.
Water managers use April 1 readings to:
- Set reservoir storage targets and release schedules
- Allocate water rights across competing agricultural and municipal users
- Issue drought advisories before summer shortages materialize
- Trigger mandatory conservation measures when SWE falls below critical thresholds
When those readings come in low, the consequences are immediate. In April 2024, Washington State declared drought for most of the state after statewide snowpack fell to 68% of normal and basin streamflows dropped below 75% of normal. The declaration enabled early allocation adjustments and conservation measures that wouldn't have been possible without continuous SWE monitoring.
The 2026 season produced an even starker illustration: NRCS reported that of 1,575 April 1, 2026 SWE measurements, 80% fell below the 20th percentile and 65% set or tied record lows — signaling widespread water shortage risk across the region.
The agricultural exposure is significant: USDA data shows irrigated farms account for more than 54% of U.S. crop sales. The Sacramento-San Joaquin Basin supplies 25 million California residents and irrigates 3 million acres of Central Valley farmland producing two-thirds of U.S. fruits and nuts. Every one of those downstream users depends on snowpack that SWE measurements must accurately capture each season.
Flood Forecasting and Infrastructure Safety
SWE functions as a leading indicator for spring flood risk. A snowpack carrying above-average water content, especially when combined with rapid warming or heavy rain, creates conditions for streamflow peaks that can overwhelm dams, culverts, roads, and bridges.
River forecast centers combine SWE readings with temperature and precipitation forecasts to issue streamflow predictions days to weeks in advance. That lead time is critical for emergency managers pre-positioning resources, alerting downstream communities, and adjusting reservoir release schedules before water arrives.
The consequences of getting it wrong are quantifiable. NOAA's documentation of the December 1996–January 1997 western storms — driven by rain falling on heavy snowpack — recorded flood damages exceeding $2 billion in California and $1 billion in western Nevada alone. NOAA's own analysis noted that forecast models generally underforecasted flows before the flooding in several affected river areas, illustrating that even well-resourced forecasting programs can miss the mark when snowpack data and model inputs are insufficient.
California's Department of Water Resources took a different approach in 2023, working directly with four counties in the Tulare Lake Basin as historically high Sierra snowpack began melting, coordinating responses weeks before peak flows arrived. Across all three sectors below, the same dependency holds: no accurate forecast without accurate SWE data.
Agriculture, Hydropower, and Ecosystem Management
SWE's downstream influence extends well beyond water utilities and flood control:
Agriculture: Farmers in snowmelt-dependent basins use SWE forecasts to plan planting schedules, determine irrigation timing, and select crops — particularly for water-intensive vegetables and orchards where irrigation windows are tight and penalties for mistiming are severe.
Hydropower: The U.S. Energy Information Administration projects hydropower generation at 259 billion kWh in 2026, roughly 6% of U.S. electricity. Operators rely on SWE to project inflow volumes for the season, balancing reservoir levels for generation against flood risk from over-storage ahead of a high-SWE melt season. A forecast error in either direction costs real output: under-store and generation capacity goes unused; over-store and drought-season reserves are lost.
Ecosystems: Streamflow timing derived from snowmelt governs fish spawning windows, riparian plant establishment, and groundwater recharge. NOAA/NMFS identifies Lower Columbia River spring-run Chinook as specifically dependent on high snowmelt flows during April through June to access headwater spawning areas. USGS research shows many western snow-fed streams now arrive one to three weeks earlier than in the mid-20th century — a shift that disrupts biological calendars calibrated to historical flow timing.
What Happens When SWE Data Is Missing or Inaccurate
Decisions made with poor SWE data don't default to caution — they default to whichever error the available data supports. That means either over-allocation (releasing too much water early, leaving reservoirs low for summer) or under-allocation (holding water unnecessarily while missing flood peaks).
The cost of both errors is concrete: misallocated water supply, missed flood warnings, and infrastructure decisions built on incomplete baselines.
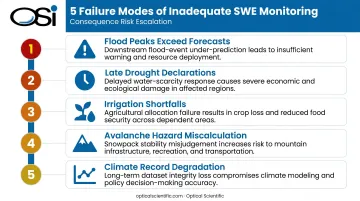
Specific failure modes from inadequate SWE monitoring include:
- Flood peaks that exceed forecast levels — NOAA documented this directly in the 1997 western floods, where models underforecasted flows before flooding began in several river areas
- Drought declarations issued too late — without continuous monitoring, SWE decline goes untracked until streamflows are already below normal
- Irrigation shortfalls — SWE-based forecasts overpredict streamflow during drought years when historical SWE-to-runoff relationships break down; adaptive drought-year sampling has been shown to reduce forecast residuals by up to 20% (Journal of Hydrometeorology)
- Avalanche hazard miscalculation — SWE loading rate is a primary snowpack instability indicator; missing or delayed readings remove a key safety signal in mountain terrain
- Climate record degradation — monitoring gaps prevent meaningful trend analysis at a time when trend data drives infrastructure and allocation planning
There's also a subtler problem: the timing of peak snowpack is shifting. The USDA Climate Hub reports that some SNOTEL sites in Idaho, Oregon, and Washington show peak snowpack moving 1–3 weeks earlier since 1982. Monitoring programs calibrated to historical timing can miss the actual peak if measurement frequency or network coverage lags behind the shift.
How SWE Is Measured
Ground-Based Methods
Two core approaches have anchored SWE monitoring for over a century:
Manual snow courses — field teams collect snow core samples at fixed sites on a scheduled basis, a practice dating to 1909 when James Church collected the first systematic snow-course data in the U.S. These courses remain valuable for validating automated systems and sampling locations inaccessible to permanent sensors.
Automated snow pillows — pressure-sensitive platforms that continuously weigh the snowpack above them and convert that weight to SWE. The USDA NRCS SNOTEL network, the most extensive automated system in the western U.S., operates over 900 sites in remote, high-elevation watersheds. SNOTEL data feeds directly into NOAA river forecast center models, including the SNOW-17 accumulation and ablation model used for operational streamflow prediction.
Remote Sensing and Emerging Methods
Ground stations can't cover every basin. Several complementary approaches extend SWE estimation into inaccessible terrain:
- Airborne LiDAR (ASO): NASA's Airborne Snow Observatory produces 50-meter resolution SWE maps by combining snow depth derived from LiDAR surveys with density modeled by iSnobal — providing basin-scale coverage at resolutions ground networks can't match
- Passive microwave satellite retrieval: NASA and NOAA both produce gridded SWE estimates from passive microwave sensors, useful for broad regional coverage but limited in forested areas and complex mountain terrain
- NOHRSC airborne gamma radiation: The National Operational Hydrologic Remote Sensing Center uses airborne gamma radiation to measure SWE across flight corridors, providing a different measurement physics from both ground and passive microwave methods
The operational trend is toward integrating all three: ground networks for high-accuracy anchoring, airborne surveys for basin-scale mapping, and satellite products for continuous temporal coverage. NOAA's California-Nevada River Forecast Center, for example, uses SNOTEL data combined with MODIS snow-covered area to inform manual SWE adjustments in its hydrological models.
Those models depend on more than SWE readings alone — accurate precipitation-type data determines how snowpack accumulates and, critically, how fast it melts. Characterizing whether precipitation arrives as snow, freezing rain, or mixed-phase is what separates a reliable streamflow forecast from a missed flood event.
OSI's optical precipitation sensors, including the OWI-430 series and APG-815-DS All Precipitation Gauge, are deployed within NOAA and National Weather Service networks to provide real-time present weather data. The APG-815-DS measures snow water equivalent rate and accumulation directly, distinguishing rain, snow, drizzle, freezing rain, and mixed precipitation — the discrimination that matters when a rain-on-snow event could accelerate snowmelt and reshape a flood forecast.
OSI sensors are also deployed with state DOTs in snow-prone regions including Vermont, Wisconsin, Wyoming, New Hampshire, and Ohio, supporting winter weather monitoring programs that feed into broader hydrological planning.
How to Get the Most Value from SWE Monitoring
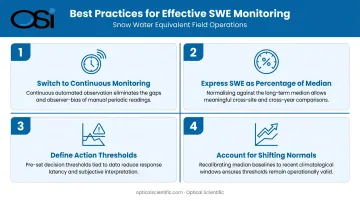
SWE data delivers its highest value when it's used actively, not just archived. Four practices separate effective programs from underperforming ones:
Switch to continuous monitoring. Monthly manual readings miss peak timing when snowpack builds or collapses fast. Automated networks reporting daily or sub-daily let managers respond before thresholds are crossed, not after.
Express SWE as a percentage of median. A reading of 12 inches means little without context. Reporting SWE as a percentage of the period-of-record median for that site and date makes it immediately clear whether conditions are normal, below, or above — and by how much.
Define action thresholds. Effective SWE programs tie readings to specific trigger points: SWE falling below 75% of median prompts irrigation restriction notices; SWE exceeding 130% of median initiates flood watch protocols. Raw data filed in a database changes nothing — thresholds tied to operational responses change outcomes.
Account for shifting normals. NRCS updates climatic normals on a 30-year rolling basis under WMO standards; the current period covers water years 1991–2020. At many sites, that baseline sits lower than the 1961–1990 or 1971–2000 normals.
A snowpack at 100% of the current normal may still represent a historically below-average water year. Managers relying solely on the most recent normal risk underestimating drought severity in years that are low by historical standards but near the new baseline.
Conclusion
SWE is the controlling variable connecting winter precipitation to summer water availability. Its importance compounds across every sector that depends on snowmelt — municipal utilities, irrigated agriculture, hydropower, and freshwater ecosystems — and its value is realized only when measurement is consistent, data is acted upon, and monitoring networks stay calibrated to shifting snowpack patterns.
As climate change pushes peak snowpack earlier and reduces baseline SWE at many sites, SWE monitoring becomes less a static government program and more an evolving operational discipline.
Sensor quality, network density, and the speed at which data translates into decisions directly determine how well utilities, water managers, and agricultural operators can adapt to a water storage system that no longer behaves as historical models predicted.
Frequently Asked Questions
What is snow water equivalent?
SWE is the depth of liquid water stored within a snowpack — expressed as the depth of water that would remain if the entire snowpack melted at once. Hydrologists and water managers use it to quantify how much usable water a given snowpack holds, as opposed to how deep the snow is.
How much snow is equivalent to 1 inch of water?
The ratio is highly variable. The NWS rule of thumb is 10 inches of snow to 1 inch of water, but the actual range spans from roughly 2 inches of dense, wet sleet to more than 50 inches of very dry, cold powder — depending on air temperature and storm type.
Why is SWE important for water resource management?
SWE determines projected spring runoff volumes, directly driving water allocation decisions, reservoir management, drought declarations, and irrigation scheduling. In snowmelt-dependent regions, the April 1 SWE reading is the primary input for the entire season's water supply forecasts.
How is SWE measured in the field?
The two primary methods are manual snow courses (field teams collecting core samples at fixed sites) and automated snow pillows within networks like the USDA NRCS SNOTEL system, which continuously records snowpack weight as real-time SWE. Airborne LiDAR and satellite methods extend spatial coverage beyond ground networks.
What is a normal or healthy SWE percentage?
SWE is assessed as a percentage of the historical median for a given site and date. A value of 100% is considered normal; readings below 75% typically trigger drought concern. Because NRCS recalculates normals every decade, 100% of the current normal may still fall below the long-term historical average.
How does climate change affect snow water equivalent?
Warming temperatures are reducing peak SWE at many monitoring sites, shifting the timing of peak snowpack earlier in the year, and increasing the share of precipitation falling as rain rather than snow. Li et al. project snowmelt's contribution to western U.S. runoff could decrease by roughly one-third by 2100 under high-emissions scenarios — a reduction that would fundamentally reshape water availability across the region.