Ambient air quality monitoring is the foundational system that gives scientists, regulators, and industries the data they need to act. It determines whether communities breathe clean air, whether industrial facilities meet legal standards, and whether pollution reduction strategies are actually working.
This guide covers everything you need to know: what ambient air monitoring is, why it matters, the pollutants tracked, monitoring methods and technologies, how networks are structured, and what to look for when selecting monitoring equipment.
Key Takeaways
- Ambient air quality monitoring measures outdoor pollutants continuously or periodically at fixed or mobile locations
- Six criteria pollutants are regulated under NAAQS — including PM2.5, ozone, NO2, SO2, CO, and lead
- Monitoring networks operate at federal, state, and local levels under EPA oversight
- Instruments span Federal Reference Methods (FRM), optical sensors, and low-cost supplemental devices
- Data informs public health decisions, AQI reporting, and regulatory compliance determinations
What Is Ambient Air Quality Monitoring?
Ambient air quality monitoring is the systematic, ongoing measurement and collection of data about pollutants present in outdoor air. The word "ambient" means surrounding or environmental — this is the air people actually breathe, at ground level in communities, near industrial facilities, and across geographic regions.
This distinguishes it from two related but different practices:
- Indoor air quality monitoring — which measures pollutants inside buildings
- Source (stack) emissions monitoring — which measures pollutants at the point of emission before they disperse into ambient air
Two Core Purposes
- Compliance assessment — determining whether outdoor air meets health-based standards like the National Ambient Air Quality Standards (NAAQS)
- Trend data generation — informing long-term pollution reduction strategies and policy decisions
How Monitoring Data Flows
Raw sensor data doesn't reach the public directly. It passes through a defined validation and reporting chain:
- Sensors collect measurements at monitoring stations
- Data undergoes QA/QC validation (automated flagging, manual review, final validation)
- Validated data gets submitted to EPA's Air Quality System (AQS) database
- The public and regulators access it via AirNow and EPA's AirData platform
- AQS data feeds the Air Quality Index (AQI) — the public-facing metric regulators and communities rely on
The AQI runs on a 0–500 scale across six color-coded categories:
| AQI Range | Category | Color |
|---|---|---|
| 0–50 | Good | Green |
| 51–100 | Moderate | Yellow |
| 101–150 | Unhealthy for Sensitive Groups | Orange |
| 151–200 | Unhealthy | Red |
| 201–300 | Very Unhealthy | Purple |
| 301–500 | Hazardous | Maroon |
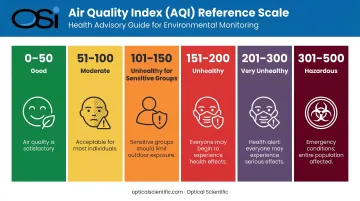
It's calculated from five major regulated pollutants, with particle pollution tracked separately as both PM2.5 and PM10. Regulators use AQI thresholds to trigger public health advisories, industrial curtailments, and permit reviews.
Why Ambient Air Quality Monitoring Matters
Health and Economic Stakes
The numbers are stark. The World Bank estimates the global health cost of PM2.5 air pollution at $8.1 trillion in 2019 — equivalent to 6.1% of global GDP. That cost covers mortality, morbidity, lost productivity, and healthcare expenditures driven by preventable exposure.
Vulnerable populations bear the heaviest burden: children, elderly individuals, and people with respiratory or cardiovascular conditions face disproportionate risk. Without monitoring data, early intervention is impossible.
Environmental Damage
Air pollutants don't just harm people — they degrade ecosystems in ways that compound over time:
- Acid rain forms when SO2 and NOx react with water and oxygen, damaging forests, soils, streams, and lakes
- Ground-level ozone reduces photosynthesis, slows plant growth, and decreases crop and commercial forest yields
- Particulate matter deposits on water bodies and disrupts aquatic ecosystems
Monitoring tracks these impacts longitudinally, giving scientists the data to connect cause and effect.
Regulatory and Legal Requirements
The environmental damage those pollutants cause is also a compliance problem. Under the Clean Air Act, state agencies must operate monitoring networks that meet EPA's siting, methodology, and data quality requirements. Facilities near populated areas must demonstrate compliance with emissions limits. States must prove attainment status to EPA — a determination that requires verified monitoring data.
Without that data, neither compliance nor accountability is possible.
Early Warning for Public Health
Compliance data addresses the past. Real-time monitoring addresses what's coming. Continuous air quality feeds enable smog alerts, AQI forecasts, and public advisories that allow sensitive individuals to limit outdoor exposure before conditions deteriorate.
When meteorological data — wind speed, temperature inversions, humidity — integrates with air quality measurements, forecast windows can extend from hours to days, giving public health officials time to act before an event peaks.
Key Pollutants Measured in Ambient Air Monitoring
The Six NAAQS Criteria Pollutants
The EPA's NAAQS framework centers on six pollutants that are the foundation of U.S. ambient air monitoring:
| Pollutant | Primary Source | Key NAAQS Limit |
|---|---|---|
| PM2.5 (fine particles) | Combustion, wildfires, industrial processes | 9.0 µg/m³ annual mean |
| PM10 (coarse particles) | Dust, industrial activity, vehicle exhaust | 150 µg/m³ (24-hour) |
| Ozone (O3) | NOx + VOC reactions in sunlight | 0.070 ppm (8-hour) |
| Carbon Monoxide (CO) | Combustion byproducts | 9 ppm (8-hour) |
| Nitrogen Dioxide (NO2) | Vehicle exhaust, power generation | 100 ppb (1-hour) |
| Sulfur Dioxide (SO2) | Fossil fuel combustion, smelting | 75 ppb (1-hour) |
| Lead (Pb) | Industrial sources, aviation fuel | 0.15 µg/m³ (rolling 3-month) |
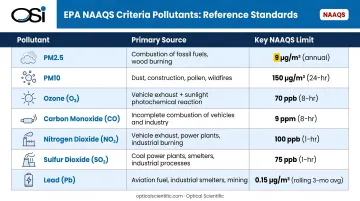
Note: PM2.5 and PM10 are both sub-categories under the single Particulate Matter NAAQS criterion.
PM2.5 vs. PM10: Why the Distinction Matters
Fine particles (PM2.5, ≤2.5 microns) are considered more dangerous than coarse particles (PM10, ≤10 microns) for one reason: size. PM2.5 particles penetrate deep into the lungs and can enter the bloodstream, causing inflammation that extends well beyond the respiratory system.
Research from the American Heart Association links PM2.5 to elevated risks of myocardial infarction, stroke, arrhythmia, and heart failure exacerbation — often within hours to days of elevated exposure. Wildfire smoke, vehicle exhaust, and industrial combustion are among the primary sources of PM2.5.
Beyond the Six: Additional Parameters
Comprehensive ambient monitoring programs regularly track parameters well beyond the six criteria pollutants:
- Air toxics — benzene, arsenic, mercury (from the National Air Toxics Assessment program)
- Volatile organic compounds (VOCs) — precursors to secondary pollutant formation
- Black carbon — a combustion byproduct linked to climate and health impacts
- Hydrogen sulfide — relevant near refineries and wastewater facilities
- Visibility — measured in meteorological optical range
- Meteorological parameters — wind speed/direction, temperature, humidity, barometric pressure
Weather directly affects how pollutants disperse and concentrate. A temperature inversion traps pollution at ground level; a wind shift can redirect emissions toward nearby communities within hours. Meteorological sensors are integral to accurate ambient monitoring — not supplementary to it.
Monitoring Methods and Network Structure
Federal Reference Methods and the Regulatory Gold Standard
Federal Reference Methods (FRM) and Federal Equivalent Methods (FEM) — defined under 40 CFR Part 53 — are EPA-approved instruments used for regulatory compliance monitoring. They deliver high-accuracy measurements from fixed stations, but they come with trade-offs:
- High purchase and installation cost
- Require skilled technicians for operation and maintenance
- Suited for compliance determination, not necessarily broad spatial coverage
Two monitor types serve different data needs:
- Continuous monitors — provide automated, real-time hourly data; common in government networks and industrial compliance applications
- Semi-continuous or integrated samplers — collect samples over set intervals (often 24 hours, sometimes on a 1-in-3 day schedule) for lab analysis; used for PM2.5 gravimetric measurements and speciated pollutant data
Emerging Technologies: Optical and Low-Cost Sensors
Those cost and coverage trade-offs create a real gap. Low-cost sensor networks and near-reference monitors address it by increasing spatial density — particularly useful in communities far from existing monitoring stations.
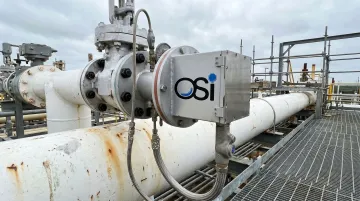
Optical-based sensors occupy a distinct category: more accurate and durable than consumer-grade devices, but built for environments where continuous, unattended operation is non-negotiable. Optical scintillation and light-scattering instruments are deployed at power plants, refineries, and industrial sites for visibility monitoring, particulate detection, and fenceline crosswind measurement.
OSI (Optical Scientific, Inc.), based in Gaithersburg, MD, has manufactured optical scintillation-based sensors for these applications since 1985. Their instruments operate at industrial facilities including refineries run by Chevron, ExxonMobil, and Shell, and have been validated by agencies including the EPA and NOAA.
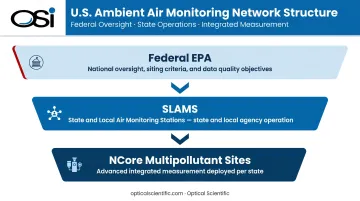
How the Network Is Structured
The U.S. ambient monitoring network operates across three tiers:
- Federal level — EPA oversees the national network, sets siting criteria, methods, and data quality objectives
- State and Local Air Monitoring Stations (SLAMS) — state and local agencies operate networks under EPA oversight, selecting sites based on population density, pollution sources, and regulatory requirements
- NCore (National Core) — a multipollutant monitoring program requiring every state to operate at least one site integrating advanced measurement systems for particles, gases, and meteorology
The coverage gap is significant. According to GAO data from 2019, **2,120 of 3,142 U.S. counties had no ambient air quality monitor** associated with EPA's monitoring system. Optical and low-cost supplemental sensors are increasingly filling that gap.
All validated data flows to EPA's Air Quality System (AQS) database, made publicly accessible through AirNow (real-time AQI) and EPA's AirData platform (historical data and reports).
What to Look for in Ambient Air Quality Monitoring Equipment
Reliability and Uptime
Monitoring data is only useful when it's continuous. Gaps in data create compliance problems and undermine trend analysis. When evaluating instruments, prioritize:
- High MTBF ratings — look for documented mean-time-between-failure figures, not just manufacturer claims
- No moving parts — mechanical components are the most common failure point; optical instruments without moving parts dramatically reduce this risk
- Built-in self-diagnostics — systems that continuously monitor their own performance and flag anomalies before they create data gaps
OSI's instruments carry an MTBF exceeding 80,000 hours and have accumulated over 800 million field hours of operation. Their built-in continuous self-diagnostics update every minute, catching potential faults before they interrupt data collection and eliminating the need for emergency site visits.
Calibration, Maintenance, and Total Cost of Ownership
Regulatory ambient monitoring requires documented QA/QC programs. Under 40 CFR Part 58, requirements include:
- One-point QC checks for gaseous monitors (CO, NO2, SO2, O3) at least every two weeks
- Annual performance evaluations for each primary gaseous monitor
- Monthly flow-rate verifications for PM2.5 monitors
- Semiannual flow-rate audits
Instruments that require minimal manual intervention (no scheduled optical cleaning, automatic gain control to compensate for contaminated optics) reduce the labor cost of meeting these requirements. OSI's optical design is insensitive to dirt buildup on optics, eliminating routine cleaning and reducing on-site visits to periodic preventative checks.
Certifications and Regulatory Recognition
For compliance monitoring, verify:
- EPA method designation (FRM or FEM) if the instrument will be used for attainment determinations
- ISO 9001:2015 quality management certification
- CE certification for European deployments or internationally sourced equipment
- Field validation by recognized agencies — EPA, NOAA, FAA, or equivalent bodies
OSI holds ISO 9001:2015 and CE certifications across their product lines. Key regulatory approvals by product include:
- OFS series — EPA 40 CFR Part 75 compliance certification for stack gas flow monitoring
- LOA-105 optical anemometer — EPA Method 14 equivalency approval for aluminum smelter applications
- OWI-430 DSP-WIVIS — approved by NOAA, EPA, and ETL for ambient air monitoring
Frequently Asked Questions
What is ambient air quality monitoring?
Ambient air quality monitoring is the systematic measurement of pollutants in outdoor air using instruments placed at fixed or mobile locations. Data is used to assess compliance with health-based standards like NAAQS and to inform public health decisions and pollution reduction policy.
What are the 12 parameters of ambient air monitoring?
The EPA mandates monitoring of six criteria pollutants — PM2.5, PM10, ozone, CO, NO2, SO2, and lead. Comprehensive programs extend well beyond that, adding air toxics, VOCs, black carbon, visibility, and meteorological parameters such as wind speed, temperature, and humidity.
Can poor air quality cause palpitations?
Research confirms a link between elevated PM2.5 and cardiovascular stress. The American Heart Association reports PM2.5 is associated with arrhythmia, with one study finding a 26% increase in atrial fibrillation risk for each 6.0 µg/m³ increase in concentration.
What is the Air Quality Index (AQI) and how is it calculated?
The AQI is EPA's standardized 0–500 scale for communicating daily air quality to the public. It's calculated from measured concentrations of five major regulated pollutants — particle pollution tracked as both PM2.5 and PM10 — and translated into color-coded categories from "Good" to "Hazardous."
What regulations govern ambient air quality monitoring in the US?
The Clean Air Act authorizes EPA to set NAAQS, and state agencies must implement monitoring networks meeting EPA's siting, methodology, and data quality requirements. State Implementation Plans (SIPs) document how each state maintains compliance — EPA reviews and must approve each SIP.
How often is ambient air quality data collected?
Continuous monitors report hourly or sub-hourly data. Integrated PM2.5 samplers typically operate on 24-hour cycles, and some speciation samplers run on a 1-in-3 day schedule depending on regulatory requirements and the specific pollutant being measured.