Introduction
Outdoor air pollution carries a severe public health burden. According to the WHO, ambient outdoor air pollution caused 4.2 million premature deaths worldwide in 2019 — and the problem hasn't eased.
The monitoring infrastructure meant to track this crisis has a critical gap: traditional regulatory networks are expensive, spatially sparse, and grid-dependent. A 2024 study in Environmental Science & Technology Letters found that 60% of U.S. counties lacked PM2.5 monitors, leaving roughly 123 million people without local air quality data.
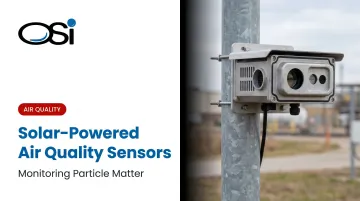
Solar-powered particulate matter (PM) sensors address this directly. Without the need for electrical infrastructure, they enable continuous, autonomous monitoring at remote industrial sites, agricultural areas, transportation corridors, and underserved communities.
Here's what this article covers:
- How PM is classified and why it matters
- How solar-powered PM sensor systems work
- Key deployment advantages and practical design considerations
- What to look for when selecting a sensor
What Is Particulate Matter and Why Does It Need Monitoring?
PM Size Classifications
Particulate matter is categorized by aerodynamic diameter — the size that determines how deeply particles penetrate the respiratory system:
| Classification | Aerodynamic Diameter | Primary Sources |
|---|---|---|
| PM10 | ≤ 10 micrometers | Dust, pollen, coarse industrial particles |
| PM2.5 | ≤ 2.5 micrometers | Combustion, vehicle exhaust, industrial emissions |
| PM1.0 | < 1 micrometer | Fine combustion byproducts, secondary aerosols |
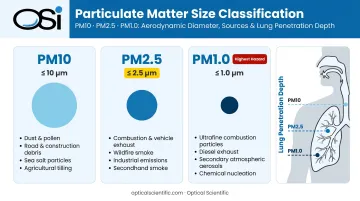
PM concentration is measured in micrograms per cubic meter (μg/m³). The finer the particle, the more hazardous it becomes — PM2.5 and smaller can penetrate deep into the lungs and enter the bloodstream.
Health and Regulatory Risks
The EPA links PM2.5 exposure to premature death in people with heart or lung disease, nonfatal heart attacks, aggravated asthma, and decreased lung function. In February 2024, the EPA tightened its current regulatory thresholds to:
- Annual PM2.5: 9.0 μg/m³ (primary standard)
- 24-hour PM2.5: 35 μg/m³
- 24-hour PM10: 150 μg/m³
Stationary source categories — from kraft pulp mills to power plants — face additional New Source Performance Standards under 40 CFR Part 60 with specific numeric PM limits. Incomplete monitoring can mean compliance failures, fines, or operational shutdowns.
That combination of tightened thresholds and facility-specific NSPS obligations is pushing more industrial operators toward continuous, distributed PM monitoring rather than periodic manual sampling.
How Solar-Powered Particulate Matter Sensors Work
A solar-powered PM monitoring unit has four core components that work together to deliver autonomous, continuous data:
- PM sensor — measures airborne particle concentration and size distribution
- Solar panel — converts sunlight to DC electricity
- Rechargeable battery — stores energy for nights and overcast periods
- Charge controller — regulates charging to protect battery longevity
PM Detection: Optical Scattering
Most low-cost PM sensors use optical particle counting — a method described by EPA where particles entering the sensor scatter light, and that scattered signal is analyzed to determine particle size distribution and mass concentration.
The process works as follows:
- A small fan draws ambient air through a detection chamber
- A laser or LED illuminates the airstream
- A photodetector measures scattered light at specific angles
- Signal processing converts scatter data to PM mass concentration (μg/m³)
PM2.5 is the most reliable output from most optical sensors. Peer-reviewed evaluations confirm that PM2.5 performance is generally stronger than PM10, because coarser particles are harder to consistently draw into and through the detection zone.
While the optical measurement itself is solid-state, most instruments use a fan for airflow. That fan is the primary mechanical component requiring attention in long-term deployments — which is why deployments in remote or harsh environments often favor sensors built around no-moving-parts measurement pathways, such as OSI's instruments, which carry MTBF ratings exceeding 80,000 hours.
Solar Power Integration
The solar panel charges the battery continuously during daylight. The battery powers the sensor through the night and during overcast periods. A charge controller sits between the panel and battery, preventing overcharge and over-discharge.
PWM vs. MPPT controllers: MPPT (Maximum Power Point Tracking) controllers extract more usable energy from the panel, particularly in cold temperatures or low-irradiance conditions. For high-latitude or seasonally variable deployments, MPPT is the better choice.
Connectivity choice drives the power budget as much as the sensor itself. A 2026 Frontiers in Sustainable Cities study of a solar-powered PM deployment found that the PM sensor itself drew approximately 0.9 W — but adding a Wi-Fi dongle pushed total load to 2 W, raising real winter outage risk. Connectivity method selection isn't a minor footnote; it's a primary power budget driver.
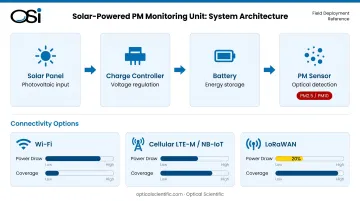
- Wi-Fi — lowest cost, but requires nearby network infrastructure
- Cellular (LTE-M/NB-IoT) — broad coverage, moderate power increase
- LoRaWAN — low power, suited for dense rural networks, limited data throughput
Key Advantages of Solar-Powered PM Sensors
Off-Grid Deployment Freedom
Solar-powered sensors eliminate dependency on grid infrastructure entirely. This opens monitoring capability at:
- Remote industrial facilities and mining sites
- Agricultural and agrimet stations
- Transportation corridors (highways, rail lines)
- Underserved communities without grid access
- Research stations, including polar and tropical environments
OSI's sensor systems, including the LP-WIVIS low-power weather identifier, have operated on every continent, including Antarctica — demonstrating what field-hardened optical instruments can sustain under genuinely remote, off-grid conditions.
Continuous, Real-Time Data
Battery backup ensures 24/7 operation. This continuity matters because:
- Pollution events can be brief and localized
- Regulatory averaging periods require gap-free time series
- Atmospheric chemistry (such as secondary aerosol formation) happens continuously, not on a schedule
Gaps in monitoring aren't just inconvenient — they can invalidate compliance records or obscure the source of an emission event.
Scalability for Dense Networks
The compact, self-contained nature of solar-powered units makes geographic scaling practical. A strong proof point: MIT deployed a 16-sensor, solar-powered wireless network across Hawaii's Big Island during the Kilauea volcanic eruption, measuring SO2 and PM in real time for public access. That kind of spatial density is impossible with traditional regulatory monitoring stations.
For industrial fence-line monitoring, this density advantage means better spatial resolution around facility perimeters — and that improved coverage has direct implications for cost-effective network design.
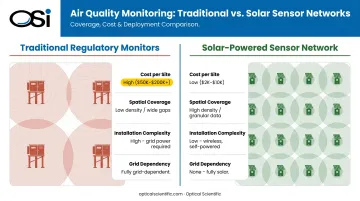
Lower Long-Term Operating Cost
Upfront hardware costs are real, but the ongoing expense picture shifts significantly with solar-powered systems. Eliminated electricity charges and fewer required technician visits reduce total cost of ownership over time. The EPA Enhanced Air Sensor Guidebook puts the contrast in stark terms:
- Regulatory-grade monitors: tens of thousands of dollars
- Low-cost optical PM sensors: typically under $2,500
That cost gap is what makes dense supplemental networks financially achievable for most industrial programs.
One clear caveat: low-cost optical PM sensors are supplemental and informational tools, not regulatory compliance replacements. When designing a monitoring program, pair them with a higher-tier reference monitor to validate readings and maintain defensible compliance records.
Deployment Considerations
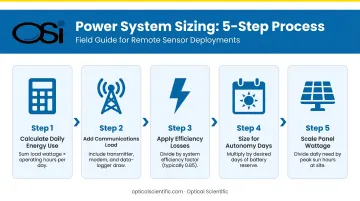
Power System Sizing
Start with the sensor's continuous power draw, then build outward:
- Calculate daily energy use — sensor wattage × 24 hours = watt-hours/day
- Add communications load — Wi-Fi or cellular can double total consumption
- Apply efficiency losses — charge controller, wiring, and battery inefficiency typically add 20–30%
- Size for autonomy days — how many consecutive sunless days must the battery cover?
- Scale panel wattage — match expected daily solar harvest (varies by latitude and season) to daily load
High-latitude and winter deployments need larger safety margins. The Frontiers Scotland study is a useful reference: a 30 W panel with a 12V/33Ah sealed lead-acid battery was marginal when Wi-Fi was added to a 0.9 W PM sensor load. That's a concrete sizing baseline for temperate deployments.
Seasonal and Climate Variability
Solar irradiance drops significantly in winter months, and cold temperatures reduce battery capacity. Neither effect is fatal to system design — but both require deliberate engineering:
- Use MPPT controllers for better low-light extraction
- Oversize battery capacity relative to summer-only calculations
- Account for shading from terrain, vegetation, or nearby structures
- Consider latitude-appropriate tilt angles for panel mounting
Siting and Regulatory Constraints
Once the power system is sized for your climate, siting the station correctly is the next constraint to resolve. EPA's 40 CFR Part 58 Appendix E sets formal criteria for PM monitoring:
- Inlet heights: 2.0 to 15 m above ground for neighborhood-scale monitoring
- Airflow clearance: at least 270 degrees of unrestricted flow
- Minimum 10 m from tree drip lines
Beyond the EPA criteria, practical siting introduces a separate set of constraints:
- Municipal or land-use permitting requirements
- Wind loading assessments for mounting structures
- Moisture risk for ground-level battery enclosures
- Vandalism exposure at unattended sites
Logistics and governance routinely drive final siting decisions just as much as the technical specifications do.
Connectivity and Maintenance Planning
For truly remote deployments, cellular or LPWAN connectivity is preferable over Wi-Fi, which requires proximity to existing network infrastructure. Key planning considerations:
- Auto-recovery from power interruptions prevents manual data-gap interventions
- Remote diagnostics reduce unnecessary site visits
- Data logging locally provides backup when connectivity drops
OSI's optical instruments include built-in continuous self-test and self-diagnostic capabilities that update every minute. For infrequently accessed sites, that on-board monitoring can replace a trip to the field.
What to Look for in a Solar-Powered PM Sensor
Measurement Accuracy and Output Compatibility
- PM2.5 measurement is the minimum requirement; PM10 capability is valuable for industrial applications
- Look for standard industrial interfaces: RS485, 4–20 mA, 0–10 V
- Modbus RTU support simplifies integration with existing data loggers and SCADA systems
- Confirm that humidity compensation is addressed — optical sensors can overcount particles in high-humidity conditions
Reliability and Low-Maintenance Design
In remote deployments, maintenance access is infrequent and expensive. Prioritize:
- MTBF exceeding 80,000 hours: OSI's optical instruments are rated for continuous operation well beyond nine years before a statistically expected failure
- Solid-state optical pathways with fewer mechanical components — and fewer failure points
- Continuous self-diagnostics that catch performance drift before it causes data loss
- No scheduled optics cleaning required: OSI sensor designs compensate automatically for dust and contamination buildup on optical surfaces
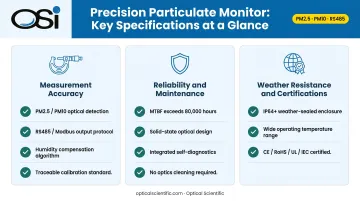
Weather Resistance and Certifications
Confirm before purchasing:
- IP64 or higher rating for outdoor dust and water resistance
- Operating temperature range suited to the deployment site — OSI sensors cover -50°C to 60°C
- CE, RoHS, and UL certifications appropriate to the deployment region and application
- EN/IEC standards compliance for international deployments
Frequently Asked Questions
What is particulate matter?
Particulate matter is a mixture of solid particles and liquid droplets suspended in air, classified by aerodynamic diameter into PM10, PM2.5, and PM1.0 size fractions. Finer particles pose greater health risks because they penetrate deeper into the lungs and, in some cases, enter the bloodstream.
What does a particulate matter sensor do?
A PM sensor continuously measures the concentration and size distribution of airborne particles in real time, typically using optical light scattering. It outputs data in micrograms per cubic meter (μg/m³) to support air quality monitoring, public health protection, and regulatory compliance.
What is a solar radiation sensor?
A solar radiation sensor (pyranometer) measures incoming solar irradiance in watts per square meter. A solar-powered air quality sensor is different: it uses a photovoltaic system as a power source to run a PM instrument that measures particles, not sunlight.
What are PM2.5 and PM10?
PM2.5 refers to fine particles with aerodynamic diameters of 2.5 micrometers or smaller, typically from combustion and industrial emissions. PM10 covers particles up to 10 micrometers, including dust and pollen. PM2.5 is considered more harmful to respiratory and cardiovascular health due to its ability to penetrate deeper into lung tissue.
How long can a solar-powered air quality sensor run without sunlight?
Battery autonomy depends on system design: sensor power draw, battery capacity, and depth-of-discharge limits all factor in. A properly engineered system with a sealed lead-acid or lithium-ion battery can typically sustain 1 to 3 days without solar input, though high-latitude winter deployments may need larger reserves.
What industries require continuous particulate matter monitoring?
Industries subject to EPA particulate emission standards under 40 CFR Part 60 include power generation, kraft pulp and paper mills, oil refining, chemical manufacturing, aluminum smelting, and cement production. These operators monitor ambient PM for fence-line compliance and community impact assessments, though specific obligations vary by source category and should be verified at the subpart level.