According to the DOE's FEMP, severe hail is now the single greatest contributor to insured losses on solar PV systems worldwide. A single event—like the May 2019 West Texas hailstorm that damaged more than 400,000 modules at Midway Solar with losses around $70 million—illustrates just how concentrated the exposure can be.
This article covers how hail damages solar PV and wind turbine assets, how to assess site-specific risk, and what monitoring and mitigation strategies give operators a defensible position before, during, and after a storm.
Key Takeaways
- Hail accounts for 54% of incurred solar loss-claim costs, with average hail claims around $58.4 million
- Solar panels suffer visible glass fractures and invisible microcracks that reduce power output and create fire risk
- Wind turbine blades develop accelerated leading edge erosion, cutting annual energy production by 2–4%
- Rural solar and wind sites are systematically undercounted in official hail databases, meaning actual exposure is higher than reported loss records indicate
- Effective protection requires resilient module specs, hail stow protocols, and on-site real-time hail detection working together
The Growing Hail Threat to Renewable Energy Assets
The US installed 49.99 GWdc of solar in 2024, with Texas alone adding 11.6 GWdc—ranking first among all states. Wind power supplied roughly 10% of US utility-scale generation in 2023, with Texas, Iowa, Oklahoma, Kansas, and Illinois accounting for about 59% of that output. Both maps overlap almost perfectly with America's most active hail regions.
The Underreporting Problem
Most utility-scale solar and wind projects are built in rural areas where population density is low and ground-level weather observation networks are sparse — which makes this exposure easy to systematically underestimate.
Research published in AMS proceedings found that counties with higher population densities show proportionally higher densities of severe wind and hail reports in NOAA Storm Events records from 1955–2024. A separate remote-sensing study found hail reports and population density are linearly correlated below about 25 people per square mile, which is precisely the density threshold where most large solar and wind projects are sited.
In practice, a rural Texas or Oklahoma solar farm could experience multiple significant hail events annually that never appear in official databases. Relying on Storm Events data alone for site risk assessment produces a false sense of low exposure.
The Module Design Problem
The industry trend toward larger, thinner modules compounds the exposure. Larger panel formats and thinner front glass reduce manufacturing cost and LCOE, but testing data shows the tradeoff in resilience.
Kiwa PVEL testing quantifies the gap clearly:
- 2.0 mm glass-glass modules: 89% breakage rate at 50 mm hail
- 3.2 mm glass-backsheet modules: 40% breakage rate at 50 mm hail
Newer module generations pushing toward the thinner end of that range are now entering service. Many are deployed directly in the most hail-active corridors in the country.
How Hail Damages Solar PV Systems
Visible and Invisible Damage Pathways
The obvious failure mode is glass breakage. When a hailstone strikes a module's front glass hard enough, it fractures the surface—blocking light, allowing moisture ingress, accelerating corrosion, and creating fire risk at exposed electrical connections.
The less obvious—and often more widespread—failure mode is microfractures. Hailstones that don't visibly crack the glass can still crack the underlying silicon cells, creating electrical separations that reduce current flow. These microcracks aren't visible to the naked eye, but their effects on production are measurable.
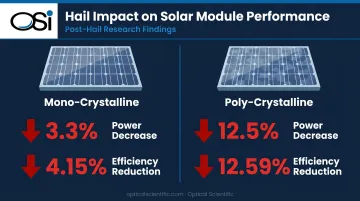
Research published in Heliyon found that post-hail mono-crystalline modules showed 3.3% power decreases and 4.15% efficiency reductions, while poly-crystalline modules fared significantly worse — 12.5% power decrease and 12.59% efficiency reduction.
The Certification Gap
The IEC 61215 baseline hail test — the standard certification most modules carry — requires 11 impacts from 25 mm (1-inch) ice balls at 23 m/s. Pass criteria: less than 5% power loss and no visible damage.
That bar looks different when you compare it to real-world thresholds:
| Standard / Source | Hail Size Referenced |
|---|---|
| IEC 61215 baseline test | 25 mm (1 inch) |
| DOE FEMP significant damage threshold | 44 mm (1¾ inch) |
| Kiwa PVEL enhanced Hail Stress Sequence | 35 mm – 55 mm |
For sites in the Great Plains or Southeast, buyers should ask vendors for results from enhanced Hail Stress Sequence testing — not just IEC 61215 baseline qualification.
Operational Defense: Hail Stow
For solar farms with single-axis trackers, hail stow is the primary operational protection. Tilting panels to steep angles—typically 50° to 75°—dramatically reduces the perpendicular impact energy when hailstones arrive. Industry data from kWh Analytics indicates that proactive hail stow implementation can reduce property insurance premiums by up to 35%.
Fixed-tilt systems have no equivalent option, making module selection and glass specification the primary mitigation lever.
Post-Event Inspection
Two methods matter for post-hail assessment:
- UV fluorescence imaging — fast, low-cost, requires no electrical connection; useful for flagging damage zones quickly across large arrays
- Electroluminescence (EL) imaging — the industry standard for characterizing microfractures; requires electrical connection but provides highly detailed imagery of cell-level damage
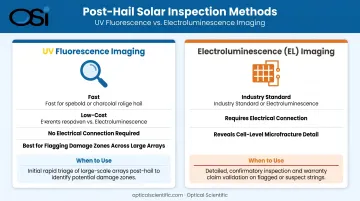
Both pre-event baseline scans and post-event comparative scans matter. Without a baseline, insurers have grounds to dispute whether damage occurred in a specific storm — complicating claims.
How Hail Affects Wind Turbine Blades
Wind turbine blades rotate at tip speeds often exceeding 150–180 mph. When hailstones collide with the leading edge at those speeds, the combined kinetic energy is substantial—far greater than what the hailstone's fall velocity alone would suggest.
Leading Edge Erosion
Repeated hail impacts cause stress waves and micro-structural damage that pit and progressively strip away the blade's protective coating. This leading edge erosion (LEE) reduces aerodynamic efficiency and, with it, annual energy production (AEP).
Research from Lopez 2023 documents AEP losses of 2.2% to 4% for advanced erosion states, and a Wind Energy Science study found wind-farm-level AEP loss of 2.7% when wake effects are included. For a large wind farm, that's a persistent revenue leak compounding over the asset's lifetime.
Hail is one contributor to LEE alongside rain, UV exposure, particles, and temperature cycling—peer-reviewed sources confirm it as a contributing mechanism, though its AEP impact hasn't been isolated from other erosion causes.
Mitigation Options
Two primary approaches exist for wind operators:
- Erosion-safe mode (ESM) — reducing rotor tip speed during damaging precipitation events to limit kinetic energy on impact; DTU research estimates this can reduce profit loss from erosion by roughly 70% in the studied context
- Leading edge protection (LEP) — sacrificial shield materials applied to the blade leading edge to absorb impact damage before it reaches the structural coating
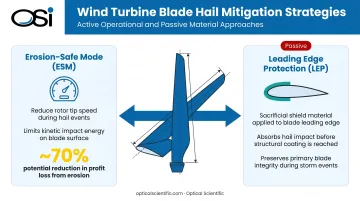
Triggering ESM effectively requires real-time precipitation type discrimination at the site—specifically, knowing when hail is falling and at what intensity, not a regional radar estimate. Ground-level sensors that can distinguish hail from rain provide the data operators need to activate ESM at the right moment.
How to Assess Hail Risk at Your Renewable Energy Site
Limitations of Historical Databases
NOAA Storm Events is a useful starting point, but the rural underreporting bias described above means it will systematically undercount hail exposure at most project sites. Complement it with:
- NOAA Storm Prediction Center maps — historical hail and wind reports from 1955–2025, with awareness of population bias
- NOAA MRMS MESH — radar-estimated hail climatology with useful spatial coverage where ground reports are sparse, though it's not a direct surface measurement
- FEMA National Risk Index — county and Census-tract level expected annual loss estimates across 18 natural hazards, including hail
- FM Global natural hazard maps — commercial-grade risk mapping for flood, earthquake, hail, and freeze
Use atmospheric potential alongside reported events. Sites in low-density areas are especially likely to be underrepresented—cross-referencing multiple sources closes that gap.
Why Radar Isn't Enough for Operations
Doppler-derived products like MESH provide broad spatial coverage and are valuable for understanding regional patterns. But radar estimates interpolate atmospheric conditions from distance and imperfectly represent actual hailstone sizes and concentrations at the surface. For triggering hail stow or ESM at a specific site, radar alone introduces timing and accuracy uncertainty that ground-level instrumentation resolves.
On-Site Ground-Level Instrumentation
Ground-level sensors measure actual conditions at the site, not inferred conditions from altitude. OSI's optical weather identification instruments—trusted by NOAA, the National Weather Service, and deployed across energy and utility applications—deliver real-time precipitation type, intensity, and hail discrimination exactly where it counts.
OSI's OWI-430-RH DSP-WIVIS combines in-beam optical scintillation, off-axis forward scattering, and acoustic detection to distinguish hail from rain, drizzle, snow, sleet, and freezing rain in real time. For operations, insurance documentation, and O&M decisions, that ground-truth distinction is what radar estimates cannot provide. Site-level sensors produce a verified, timestamped record of what actually fell—and when.
Key use cases for on-site hail instrumentation:
- Triggering automated hail stow on solar trackers before impact
- Documenting event timing and severity for insurance claims
- Supporting post-storm O&M inspections with precise hail onset data
- Building a site-specific climatological record over the project lifetime
Hail Mitigation and Monitoring Solutions
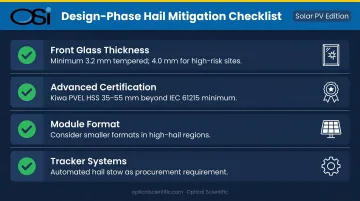
Design-Phase Choices
Getting module and system specs right from the start is the most cost-effective mitigation:
- Front glass thickness: Minimum 3.2 mm tempered glass; 4.0 mm for high-hail-risk sites
- Advanced certification: Specify modules tested beyond IEC 61215 minimum—look for Kiwa PVEL HSS (35–55 mm) or equivalent enhanced hail test results
- Smaller module formats: Larger format panels with thinner glass increase hail vulnerability; consider tradeoffs for high-risk regions
- Tracker systems with automated hail stow: Hail stow capability should be a procurement requirement, not an afterthought
Operational Protocols Before and After Events
Before a hail event:
- Activate hail stow (50°–75° tilt) when nowcast confirms hail threat within 30–90 minutes
- Consider powering down the system before impact
- Document the stow angle and activation time for post-event records
After a hail event:
- Do not restore power before completing visual and drone inspection
- Conduct UV fluorescence survey to flag damage zones
- Follow with EL imaging to characterize any microfractures
- Document hail size evidence (splatter patterns, photos, sensor records)
- Compile a complete response timeline for the insurance file
A documented protocol matters as much as the actions themselves—insurers need the evidence chain.
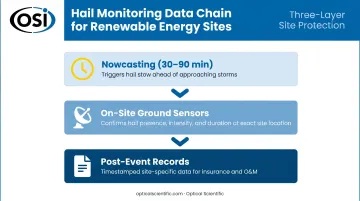
Real-Time Monitoring Integration
Effective hail monitoring depends on a layered data chain, not any single instrument:
- Nowcasting (30–90 minutes): Short-range forecasting updated frequently to trigger hail stow ahead of storms
- On-site sensors: Ground-level confirmation of hail presence, intensity, and duration at the specific site
- Post-event records: Timestamped, site-specific data documenting what actually occurred
OSI's OWI and APG series instruments report precipitation data with instantaneous intensity updates every 10 seconds and full data refreshes once per minute. That update rate is fast enough to support automated stow activation. Communication interfaces include RS-232 (standard), MODBUS RTU, RS-485, Ethernet, and cellular modems—compatible with solar tracker SCADA systems and wind turbine control logic.
The HIP-100 acoustic hail sensor, designed as an add-on to OSI's OWI series, specifically addresses the challenge of distinguishing solid ice particles from water droplets optically. Combining acoustic and optical signals achieves reliable hail discrimination that optical measurement alone cannot guarantee.
Why Ground-Truth Data Matters for Insurance
Insurers are increasingly scrutinizing site-specific hail documentation when processing claims. Post-event sensor records that confirm hail size, duration, and intensity at the exact project location:
- Accelerate claim processing by eliminating disputes over whether hail actually occurred at the site
- Differentiate operators who can demonstrate documented hail defenses
- Support premium optimization—kWh Analytics data indicates proactive hail stow alone can reduce property insurance premiums by up to 35%
The same documentation logic applies to wind operations. When a curtailment decision triggers an ESM response, high-quality on-site precipitation data—capturing what hail size and intensity actually occurred—creates an auditable record for blade warranty claims and O&M cost attribution.
OSI's instruments are built with no moving parts, rated for continuous 24/7 operation from -50°C to 60°C, and carry MTBF ratings exceeding 80,000 hours. At remote, unmanned renewable energy sites where a service visit can cost thousands of dollars, that reliability means the sensor is recording when a storm hits—not down for maintenance.
Frequently Asked Questions
Is hail a problem for solar panels?
Yes. Hail causes visible glass breakage, invisible cell microfractures that cut power output, and progressive moisture-related degradation. It's the leading source of insured solar losses in the US—accounting for more than 54% of incurred loss-claim costs by one industry estimate.
How big does hail need to be to damage solar panels?
The IEC 61215 baseline certification test uses 25 mm (1-inch) hailstones, but even smaller hail can cause invisible cell microcracks. The DOE's FEMP guidance identifies 44 mm (1¾ inch) as the size above which significant visible glass damage becomes substantially more likely.
What solar panels can handle hail?
Panels with at least 3.2 mm tempered front glass and enhanced hail test certifications beyond IEC 61215 minimum offer meaningfully better resilience. RETC data shows 3.2 mm tempered glass is roughly twice as resilient as 2.0 mm heat-strengthened glass at 50 mm hail. No panel is immune to very large hail—module selection should be paired with site-level risk assessment.
How does hail affect wind turbine blades?
Hailstone impacts on rotating blades accelerate leading edge erosion by causing micro-structural damage to protective coatings at the point of highest kinetic energy. This degrades blade aerodynamics, reduces annual energy production, and shortens coating lifetime—particularly in high-hail regions like Texas and the southern Great Plains.
Can hail damage to renewable energy equipment be detected after the fact?
Visible damage is identifiable through drone inspection and ground surveys. Invisible microfractures require UV fluorescence or electroluminescence (EL) imaging—hidden cracks spread over time, driving progressive production losses and elevated fire risk, which makes post-event testing critical.
How can renewable energy operators monitor for hail events at their sites?
The most reliable approach combines radar-based forecasting for advance warning with on-site optical sensors that confirm hail type, intensity, and duration at the exact location. That ground-truth data drives automated protective actions, insurance documentation, and O&M decisions.