That rate — rainfall intensity — is what drives real-world consequences across aviation, transportation, flood forecasting, and infrastructure design. Yet measuring it accurately is harder than it sounds, and the errors that creep into intensity data carry operational costs.
This guide covers what rainfall intensity is, how it's calculated, which instruments measure it, where measurement goes wrong, and how that data gets applied in critical operational contexts.
Key Takeaways
- Rainfall intensity measures the rate of rainfall (depth per unit time, expressed as mm/hr or in/hr), not total accumulation
- Main instruments include tipping bucket gauges, weighing gauges, weather radar, and optical precipitation sensors — with accuracy varying significantly by type and conditions
- Tipping bucket gauges can underestimate intensity by 2%–30%, with serious errors above 50 mm/hr
- Standard classifications: light (<2.5 mm/hr), moderate (2.5–7.5 mm/hr), heavy (7.6–50 mm/hr), violent (>50 mm/hr)
- Real-time intensity data directly informs aviation safety, flood forecasting, road management, and infrastructure design decisions
What Is Rainfall Intensity?
Rainfall intensity is the rate at which rain falls over a given time period, expressed as depth per unit time. The formula is simple:
I = P / T
Where I is intensity (mm/hr), P is precipitation depth (mm), and T is duration (hours).
The same 30 mm of rain produces very different intensities depending on how fast it falls:
| Scenario | Depth | Duration | Intensity |
|---|---|---|---|
| Slow, steady rain | 30 mm | 6 hours | 5 mm/hr (moderate) |
| Fast, intense storm | 30 mm | 30 minutes | 60 mm/hr (violent) |
Intensity vs. Accumulation
These two measurements are often confused but serve different purposes:
- Rainfall accumulation (mm): Total depth of water that has fallen — a running total
- Rainfall intensity (mm/hr): The rate at which it falls at any given moment
A gauge can record 30 mm of accumulation without ever telling you whether that rain fell hard enough to overwhelm a storm drain or gently enough to soak into the soil. Intensity fills that gap.
Intensity is typically expressed as an hourly-equivalent rate even when measured over a 5- or 10-minute window. This standardization allows direct comparison across sites and storm events — and it underpins the classification thresholds that agencies worldwide rely on to categorize storm severity.
Standard Classification Thresholds
The WMO and Canada's MANOBS (8th Edition, Amendment 2, February 2023) classify rainfall intensity as follows:
| Category | Rate |
|---|---|
| Light | ≤ 2.5 mm/hr |
| Moderate | 2.5–7.5 mm/hr |
| Heavy | 7.6–50 mm/hr |
| Violent | > 50 mm/hr |
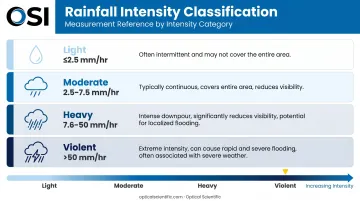
Weather agencies, aviation authorities, and civil engineers use these thresholds to trigger operational responses — road weather advisories, flight holds, and storm drain capacity assessments all depend on knowing which category a storm falls into.
Why Accurate Rainfall Intensity Measurement Matters
The Runoff Connection
When rainfall intensity exceeds a soil's infiltration capacity, water stops soaking in and starts running off. According to USDA NRCS, when rainfall is received at a rate exceeding a soil's infiltration rate, runoff moves downslope or ponds on the surface. This mechanism drives flash flooding, erosion, and combined sewer overflows.
NOAA's National Severe Storms Laboratory confirms that flash floods occur when heavy rainfall simply exceeds the ground's ability to absorb it — and the national 30-year average for flood deaths stands at 88 per year.
The engineering tool that translates intensity data into infrastructure sizing is the Intensity-Duration-Frequency (IDF) curve: a statistical relationship built from long-term rainfall records showing the maximum expected intensity for a given storm duration and return period. Engineers use IDF curves to size:
- Culverts and storm drains
- Retention and detention basins
- Dam spillways
- Combined sewer systems
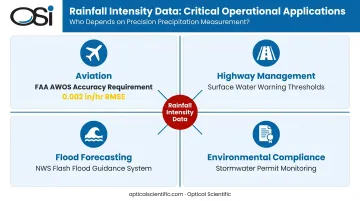
Operational Sectors That Depend on It
Intensity data isn't just for hydrologists. Across multiple sectors, specific decisions hinge on getting it right:
- Aviation: FAA AC 150/5220-16E requires AWOS precipitation sensors to cover 0.01–5 inches per hour with accuracy of 0.002 in/hr RMSE or 4% of actual, whichever is greater, directly informing safe departure and approach decisions
- Highway management: Road weather networks use intensity thresholds to trigger surface water warnings and pavement treatment advisories
- Flood forecasting: NWS Flash Flood Guidance systems use real-time intensity inputs from gauges and radar to issue threshold-based alerts
- Environmental compliance: Stormwater permits and discharge monitoring programs require documented precipitation data to validate compliance records
Inaccurate intensity readings in any of these contexts carry direct consequences: undersized drainage infrastructure, missed flood warnings, or grounded flights based on faulty weather data.
Instruments Used to Measure Rainfall Intensity
Tipping Bucket Rain Gauges
The most widely deployed instrument type. A funnel directs water into a calibrated see-saw bucket; each tip is electronically recorded with a timestamp, allowing intensity to be calculated at 5- or 10-minute intervals.
The core limitation: at high rain rates, water continues flowing into the bucket while it's mid-tip. That water goes unrecorded. A 2025 Royal Meteorological Society review found that modern tipping bucket gauges show nonlinear underestimation errors generally between 2% and 30%, with serious errors occurring above 50 mm/hr. Wind compounds this by deflecting rainfall away from the collection orifice — field studies report undercatch of roughly 10%–23% depending on wind exposure.
Weighing Gauges
Rather than counting tips, these measure the continuously increasing mass of collected precipitation. The result is a real-time depth and rate reading without a tipping mechanism.
Key advantages:
- Reduced undercounting during heavy rain events
- Handles all precipitation types (rain, snow, hail) in a single instrument
- Better performance at high intensities compared to tipping buckets
The trade-off is higher cost and greater complexity, which makes them less common in large monitoring networks.
Weather Radar (Ground-Based Doppler)
Radar sends microwave pulses through the atmosphere; precipitation particles scatter the signal back, and that backscatter is processed into intensity estimates across wide spatial areas. The standard Z-R relationship (Z = 200R^1.6, per the Marshall-Palmer equation) converts reflectivity to rainfall rate.
Radar measures backscatter, not rainfall directly — and that distinction introduces several error sources:
- Hail contamination inflates rainfall rate estimates; the NWS WSR-88D system truncates computed rates above 103.9 mm/hr specifically to compensate
- Terrain blockage and beam overshooting reduce accuracy in mountainous areas
Radar's value lies in spatial coverage for real-time flood forecasting, not point accuracy.
Optical Precipitation Sensors
Optical sensors measure precipitation by detecting how hydrometeors disrupt a light beam as they pass through an optical sensing volume. This approach enables direct measurement of precipitation type, drop size, and intensity, without collecting water in a container.
Compared to mechanical gauges, optical sensors eliminate the three most common error sources:
- No moving parts — no mid-tip undercounting, no mechanical wear
- No collection orifice — wind-induced catch deficiency doesn't apply
- Continuous self-diagnostics — sensor health monitored automatically, not at scheduled inspections
- Measurement range — capable of accurately measuring from trace precipitation through extreme intensities exceeding 500 mm/hr
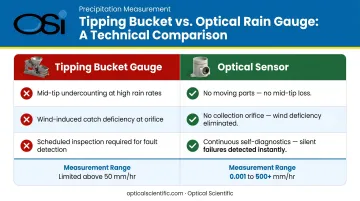
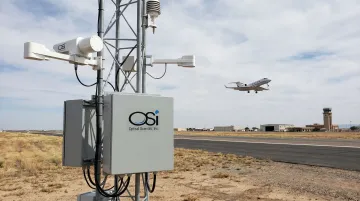
OSI's optical precipitation sensors, including the APG-815-DS All Precipitation Gauge and ORG-815-DS Optical Rain Gauge, use patented optical scintillation technology to measure instantaneous rain rate from 0.001 to 500+ mm/hr with 5% accumulation accuracy. These sensors are deployed at airports, highway road weather networks, and monitoring installations operated by agencies including NOAA and the FAA.
Satellite-Based Estimation
NASA's Global Precipitation Measurement (GPM) mission extends coverage to regions without ground gauge networks, using passive microwave sensors and the Dual-frequency Precipitation Radar to estimate intensity globally. GPM's IMERG dataset provides estimates back to 1998.
The limitation: satellite estimates tend to underestimate peak intensities and require calibration against ground-truth instruments. Satellite data works well for large-scale climatological analysis but isn't sufficient for operational flood warning or aviation weather reporting at the point scale.
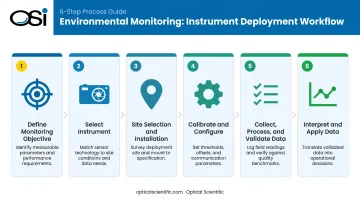
How to Measure Rainfall Intensity: A Step-by-Step Process
Most measurement errors don't come from sensor failure. They come from skipping site assessment, misconfiguration, or failing to apply corrections to raw data.
Step 1 – Define the Monitoring Objective
What the data will be used for determines everything downstream:
- Aviation AWOS reporting → 1-minute update intervals, FAA accuracy requirements
- Flood threshold alerting → Real-time intensity with sub-5-minute resolution
- IDF analysis → Long-term historical record at consistent intervals
- Compliance reporting → Documented, validated data with audit trail
Point measurement suffices for most applications. Spatial coverage via radar is needed for watershed-scale flood forecasting.
Step 2 – Select the Right Instrument
| Application | Recommended Instrument |
|---|---|
| Standard hydrometeorological network | Tipping bucket gauge |
| Mixed precipitation (snow, hail) | Weighing gauge |
| High-intensity events, low maintenance | Optical sensor |
| Spatial mapping over large areas | Weather radar |
Where maintenance burden must be minimized — at remote sites, solar-powered installations, or critical infrastructure — no-moving-parts designs reduce failure risk and service visits across a deployment's multi-year service life.
Step 3 – Site Selection and Installation
WMO guidelines specify that gauges should be placed in open, level ground with no nearby obstructions closer than twice the obstruction's height. Wind exposure, nearby structures, and vegetation all introduce systematic catch errors that are difficult to correct after installation. Improper siting is one of the most common and hardest-to-fix sources of measurement bias.
Step 4 – Calibrate and Configure
Tipping bucket gauges must be calibrated at multiple flow rates, because bucket volume per tip varies with intensity. At high rain rates, more water escapes mid-tip, causing recorded depth to understate actual accumulation. Algorithm-based intensity correction — using time-between-tip measurements to estimate the lost water — can be embedded in firmware and applied in real time, reducing this error substantially. Some residual bias remains.
Optical sensors using AGC (Automatic Gain Control) and adaptive algorithms compensate for environmental factors automatically. Calibration is typically required only every two years, rather than after each storm season.
Step 5 – Collect, Process, and Validate Data
Raw tip counts or optical readings are converted to intensity values at defined intervals. Validation steps include:
- Checking for stuck gauges or frozen sensors
- Reviewing sensor self-test flags
- Flagging unrealistic values (for example, sustained 200 mm/hr readings from a gauge in a light drizzle area)
- Cross-checking against nearby gauges or radar to identify outliers
Sensors with continuous self-diagnostic capability significantly reduce the risk of silent failure going undetected across a network.
Step 6 – Interpret and Apply the Data
How intensity time series are used depends on the application:
- Real-time alerts: Compare instantaneous intensity against pre-set thresholds; trigger notifications when exceeded
- IDF construction: Fit historical intensity records to probability distributions to estimate design storm parameters
- Storm event reporting: Aggregate data into peak intensity, duration, and total depth summaries for compliance or research records
Key Sources of Measurement Error and How to Minimize Them
Intensity-Related Undercounting in Tipping Buckets
At high rainfall rates, water continues flowing into the bucket while it's mid-tip. The tip records correctly, but the water that entered during the tipping action is lost from the count. This error is nonlinear — it grows with intensity and becomes serious above 50 mm/hr. Algorithmic correction using time-between-tip data reduces this error substantially, but cannot fully eliminate it at extreme intensities. At that point, the physics of mechanical collection become the binding constraint.
Wind-Induced Catch Deficiency
Wind deflects rainfall away from the gauge orifice and creates turbulence above the rim, reducing catch efficiency. Field experiments report undercatch of approximately 10%–23% depending on wind exposure conditions. Aerodynamic gauge designs and wind shields (Alter or Nipher configurations) reduce this effect for mechanical gauges. Optical sensors that measure precipitation passing through an optical beam — rather than collecting it — are not subject to catch-area physics and remain accurate in high-wind conditions.
Clogging, Evaporation, and Maintenance Lapses
Tipping bucket gauges face several failure modes that optical sensors largely sidestep:
- Debris and biofilm can block funnels or tipping mechanisms, causing entire events to go unrecorded
- Evaporation from the collection bucket between tips undercounts light rain
- Maintenance lapses in large networks are difficult to prevent — and each missed inspection is a data gap
Optical sensors with no open collection surfaces and built-in continuous self-diagnostics avoid most of these failure modes by design. For large networks, that difference in maintenance burden adds up quickly.
How OSI Can Help
Optical Scientific, Inc. (OSI) has been developing optical precipitation and present weather sensors since 1985. With over 800 million field hours of sensor data embedded in their algorithms, OSI's instruments have been validated across every climate condition and precipitation intensity — from Antarctic research stations to tropical Pacific buoys.
OSI's optical sensors directly address the core limitations of mechanical rain gauges:
- Eliminates mid-tip undercounting and mechanical wear with no moving parts
- Removes wind-induced catch deficiency with no open collection orifice
- Supports unattended deployments with MTBF exceeding 80,000 hours
- Detects silent failures immediately through built-in continuous self-diagnostics
- Measures from 0.001 to 500+ mm/hr — accurate from trace drizzle through violent storm events
These capabilities are already at work across some of the most demanding environments in the country. OSI's sensors are deployed in FAA-certified AWOS systems at airports and helipads, road weather monitoring networks operated by state DOTs including Maryland, Ohio, Wisconsin, Wyoming, Vermont, and New Hampshire, and environmental monitoring installations run by NOAA and NASA.
The APG-815-DS and ORG-815-DS gauges provide minute-by-minute precipitation rate and accumulation, with instantaneous intensity readings every 10 seconds — the resolution that real-time operational decisions require.
To discuss precipitation measurement requirements for aviation, transportation, environmental monitoring, or government infrastructure, contact OSI at info@opticalscientific.com or call +1 301-963-3630.
Frequently Asked Questions
How do you measure rainfall intensity?
Rainfall intensity is calculated by dividing the total depth of rainfall (mm) by the time period (hours) using the formula I = P / T. Automated instruments — tipping bucket gauges, weighing gauges, or optical sensors — record precipitation timing and accumulation to compute intensity at fine intervals, typically every 5 or 10 minutes.
What are the levels of rainfall intensity?
Per WMO and MANOBS standards, rainfall intensity is classified as light (≤2.5 mm/hr), moderate (2.5–7.5 mm/hr), heavy (7.6–50 mm/hr), and violent (>50 mm/hr). These thresholds are used by weather agencies, engineers, and aviation authorities to categorize storm severity and trigger operational responses.
What is the difference between rainfall intensity and rainfall accumulation?
Accumulation (mm) is the total depth of water that has fallen over a period. Intensity (mm/hr) is the rate at which it falls. Two storms can deliver identical accumulation totals but produce entirely different flood, erosion, and drainage impacts depending on how fast that water arrived.
What causes errors in rainfall intensity measurement?
Three error sources dominate:
- Intensity undercounting: Tipping bucket gauges lose water during the mechanical tip at high rain rates
- Wind-induced catch deficiency: Rainfall deflects away from the gauge orifice in high winds
- Maintenance failures: Clogging or evaporation reduces recorded accumulation between service visits
How is rainfall intensity used in flood forecasting?
Real-time intensity data from gauges and radar feeds into hydrological models to estimate runoff rates and predict when river flows will exceed flood thresholds. Threshold-based alert systems trigger warnings when intensity surpasses defined limits for a given duration, which is especially important in flash-flood-prone urban and mountainous areas.
What is an IDF curve and why does it matter for infrastructure design?
An Intensity-Duration-Frequency (IDF) curve is a statistical tool built from long-term rainfall records showing the maximum expected intensity for a given storm duration and return period — for example, a 50-year event. Engineers use IDF curves to size storm drains, culverts, retention basins, and spillways so infrastructure can handle design storms without failure. NOAA Atlas 14 is the primary source for these estimates across the United States.