Introduction
Turbulence costs the aviation industry an estimated $100 million per year — and that figure covers only injuries, equipment damage, inspections, and rerouting. It doesn't capture the deeper operational disruption that follows every serious encounter.
Between 2008 and 2022, turbulence accounted for 152 of 420 Part 121 accidents reported to the FAA — 36% of all accidents in that category, each involving at least one serious injury. Most of those injuries were preventable with better situational awareness.
The problem isn't that turbulence is hard to avoid. It's that for decades, the data describing it was too subjective and inconsistent to act on reliably. A pilot calling in a "rough ride" over Kansas tells the next crew almost nothing they can use to quantify risk.
That's changed. Today, turbulence measurement is an objective, multi-source discipline spanning aircraft sensors, ground-based radar, satellite feeds, and optical instruments.
This guide covers how it works — from the physics behind turbulence onset to the forecasting systems that route flights around it, and the ground-based sensors that protect airports, highways, and industrial sites.
Key Takeaways
- Turbulence is chaotic atmospheric motion caused by eddies, wind shear, convection, and mechanical forces
- Eddy Dissipation Rate (EDR) is the ICAO-standard metric for turbulence, valued because it's objective and aircraft-independent
- Key measurement methods: in-aircraft sensors, NEXRAD radar, ADS-B data, and optical scintillation sensors
- Four intensity levels — Light, Moderate, Severe, and Extreme — correspond to specific EDR thresholds
- EDR data supports aviation forecasting, DOT road weather systems, and industrial atmospheric monitoring
What Is Turbulence and Why Measuring It Accurately Matters
Air in motion follows two basic patterns: smooth laminar flow, where air moves in parallel layers, and chaotic turbulent flow, where those layers break down into irregular eddies. The Reynolds number — defined by NASA as the ratio of inertial to viscous forces (Re = V × L / ν) — predicts when that transition happens. High Reynolds numbers mean turbulence is likely; low numbers favor laminar flow. This relationship governs everything from airfoil design to industrial duct engineering.
In the atmosphere, turbulence is driven by several mechanisms:
- Wind shear — adjacent air masses moving at different speeds or directions
- Convection — warm air rising rapidly through cooler surrounding air
- Orographic lift — air deflected over terrain features like mountain ridges
- Wake turbulence — rotor vortices shed from aircraft wingtips
Why Subjective Descriptions Fail
Ask two pilots to describe the same air mass and you'll often get two different answers. A light regional turboprop reacts very differently to moderate shear than a wide-body jet at cruise weight. Traditional PIREPs used terms like "light chop" or "moderate turbulence" — descriptions of the aircraft's response, not the atmospheric condition itself.
That inconsistency has real consequences. The NTSB found that in one study, PIREP turbulence locations differed from actual EDR measurement data by an average of 25 miles. For a flight crew making a tactical deviation decision, that gap matters.
Standardized, objective measurement fixes this by describing the air mass itself — not the aircraft's reaction to it. The sections below cover exactly how that's done, from classical fluid dynamics to modern onboard sensing.
The Primary Metrics Used to Measure Turbulence Intensity
Eddy Dissipation Rate (EDR): The Standard
EDR is the internationally adopted metric for aviation turbulence, officially recognized by ICAO and confirmed as the standard by both the FAA and NTSB. It quantifies the rate at which turbulent kinetic energy dissipates in the atmosphere (specifically, the cube root of that dissipation rate) expressed in units of m²/³ s⁻¹.
The critical advantage of EDR is that it measures the atmosphere, not the aircraft. The same air mass produces the same EDR value whether a Cessna or a 777 flies through it. A light turboprop at EDR 0.35 may see significant movement while a heavy wide-body barely registers it — because aircraft responses vary by weight, wing loading, and speed, but the EDR value does not. Flight crews and dispatchers work with that atmospheric property first, then layer in aircraft-specific performance knowledge.
ICAO EDR Severity Thresholds
Based on ICAO/WAFS training material, the four turbulence intensity categories map to EDR as follows:
| Category | Peak EDR Range | Practical Effects |
|---|---|---|
| Light | > 0.10 to < 0.20 | Slight bumpiness; occupants may feel seat belt tension |
| Moderate | ≥ 0.20 to < 0.45 | Difficulty walking; unsecured items may dislodge |
| Severe | ≥ 0.45 | Large abrupt altitude/attitude changes; possible momentary loss of control |
| Extreme | Upper end of Severe range | Potential structural stress; rarely encountered |
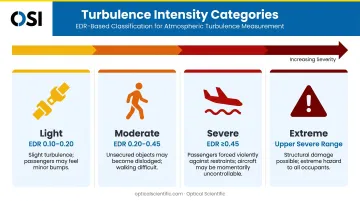
These thresholds are guides, not hard lines. The atmospheric difference between EDR 0.19 and EDR 0.21 is negligible — crews should treat the boundaries as zones, not sharp cutoffs.
A Note on Older Methods
Before EDR became the standard, pilots filed PIREPs using purely descriptive language such as "light chop," "moderate," or "severe." These reports remain in use, but their limitations are clear: they're subjective, aircraft-dependent, spatially imprecise, and typically filed minutes after the encounter. EDR replaced this approach because it produces consistent, comparable data regardless of who — or what aircraft — is doing the reporting.
Methods and Instruments Used to Measure Turbulence
In-Aircraft EDR Algorithms
Modern equipped aircraft compute EDR continuously using onboard sensor data. The inputs include:
- Vertical acceleration
- True airspeed and Mach number
- Angle of attack
- Pitch and roll angles
- Static and dynamic pressure
Avionics process these parameters in real time and transmit EDR values automatically via ACARS or equivalent data links. This turns every equipped aircraft into a moving turbulence sensor — producing objective, georeferenced data across thousands of flight miles daily.
Ground-Based Radar: NEXRAD NTDA
The NEXRAD Turbulence Detection Algorithm (NTDA) infers in-cloud EDR from spectrum width measurements collected by ground-based Doppler radar. It processes data from 133 NEXRAD stations across the CONUS, producing a mosaic that:
- Updates every 5 minutes
- Achieves 2-km horizontal resolution
- Resolves to 3,000-ft vertical increments
NTDA covers only areas with precipitation present — it cannot detect clear-air turbulence — but within those constraints it delivers high-resolution, near-real-time turbulence mapping.
ADS-B-Based Detection
In oceanic and remote airspace where radar coverage doesn't exist, ADS-B transponder data extends detection capability. By differentiating vertical rate data from ADS-B broadcasts, algorithms calculate vertical acceleration and derive EDR estimates. Research from ICAO APAC and Hong Kong Observatory has confirmed that RMS vertical acceleration from ADS-B correlates well with EDR from Quick Access Recorder data.
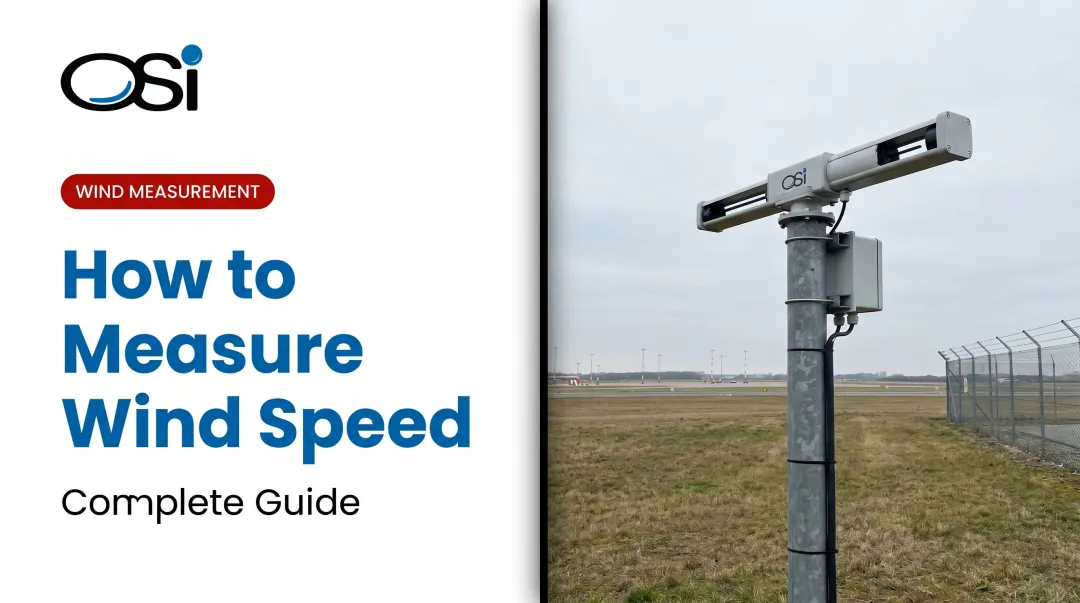
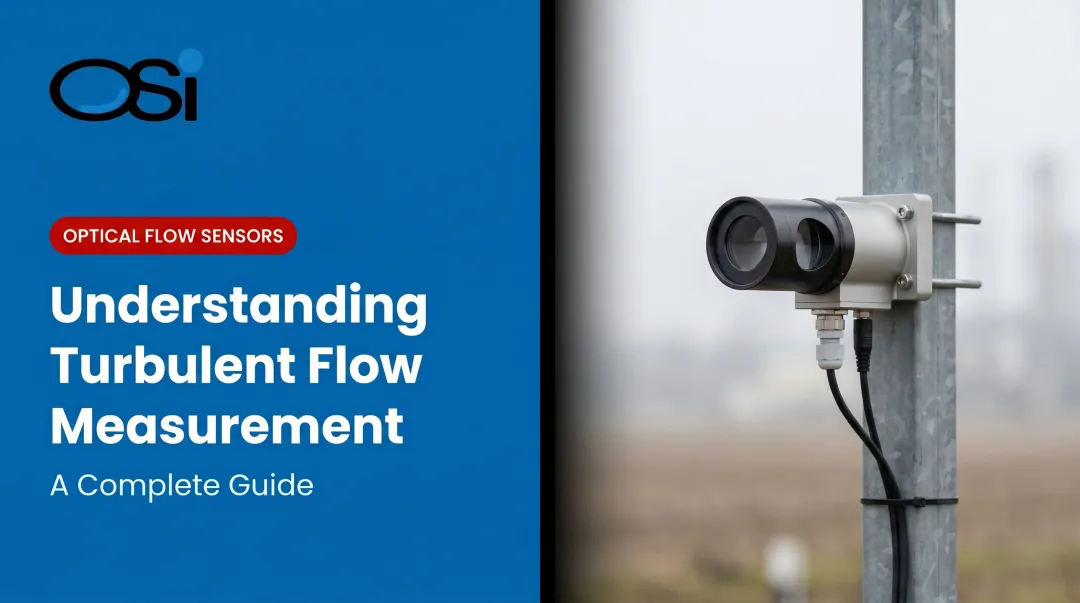
Optical Scintillation Sensors
Ground-based optical sensors offer a complementary measurement approach — particularly useful at airports, along highways, and at industrial facilities where point-specific surface-level turbulence data is needed.
These sensors transmit an infrared beam across a measurement path and detect fluctuations in received light caused by refractive index variations in the air. Turbulent eddies create temperature and density differences that alter how light travels along the path.
The result is a quantified turbulence parameter — specifically Cn², the atmospheric refractive index structure parameter — measured continuously and averaged across the full optical path.
OSI's LOA-005 Long-baseline Optical Anemometer uses this principle to detect Cn² air turbulence and crosswinds across paths from 100 meters to over 10 km. Unlike point sensors that sample a single location, the LOA delivers path-averaged measurements that reflect conditions across the entire monitored zone — not just a single point.
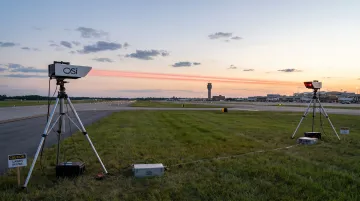
OSI collaborated with NASA in 2011 to develop the NASVOR system, deploying LOA technology for real-time wake vortex and turbulence detection during aircraft takeoffs and landings. Initial testing confirmed the system's accuracy and viability for operational airport use.
Pilot Reports (PIREPs)
PIREPs remain part of the operational picture despite their limitations. Their value lies in real-time human confirmation — a crew reporting severe turbulence at a specific location and altitude is direct evidence that the atmosphere is active there. Modern blended systems combine PIREPs with automated EDR data, using each source to validate and refine the other. That combination of human observation and automated measurement feeds directly into the forecast systems that turn raw data into actionable turbulence guidance.
From Raw Data to Turbulence Forecasts
The Graphical Turbulence Guidance (GTG) system synthesizes multiple inputs into a single EDR-based forecast product. GTG ingests outputs from 10 turbulence algorithms, compares them against PIREPs and AMDAR automated reports, weights each algorithm by demonstrated accuracy, and produces hourly CONUS forecasts with lead times up to 18 hours. A global version (GTG-G) extends coverage worldwide on 0.25-degree and 1.25-degree grids.
For tactical decisions, the GTG Nowcast (GTGN) updates every 15 minutes, merging recent EDR observations from in-situ aircraft, PIREPs, and NTDA data with a short-range GTG forecast as a first-guess field. GTG is designed for route planning; GTGN is designed for immediate avoidance decisions.
How Turbulence Measurement Data Supports Critical Operations
Aviation
EDR data and GTG products enable:
- Pre-flight route optimization — dispatchers select altitudes and tracks that avoid forecast turbulence corridors
- In-flight tactical deviations — GTGN's 15-minute updates support altitude change requests and course adjustments
- Seat belt sign management — crews use real-time EDR reports from preceding aircraft to anticipate encounters
- Airport AWOS integration — automated weather observing systems incorporate real-time atmospheric data to support ground-to-air situational awareness
Transportation Infrastructure
State DOTs use crosswind and turbulence data from roadside sensors to make time-sensitive closure decisions. Two examples show how this plays out in practice:
- Wyoming DOT deployed wind monitoring on high-risk corridors to support weight-based wind closures on interstate routes
- Florida DOT installed high-wind alert systems on road bridges to assist closure managers with real-time threshold data
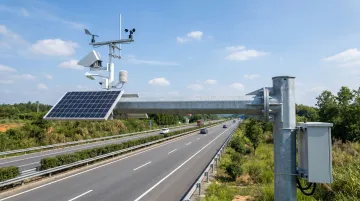
Path-averaged sensors are particularly well-suited here. A single point sensor can miss the flow pattern across a wide roadway span, which is why DOTs across the U.S. use the LOA-005 for crosswind monitoring along highways and bridges. Its 24/7 continuous operation and 6-month maintenance interval make it practical for remote roadside deployment.
Research and Industrial Applications
Accurate turbulence measurement supports:
- Atmospheric dispersion modeling — EPA's AERMOD system uses boundary layer turbulence parameters to characterize how emissions disperse from industrial stacks
- Fence-line monitoring — at refineries and chemical plants, path-averaged optical sensors track air movement patterns that determine how accidental releases would propagate, enabling faster emergency response
- Climate and boundary layer research — NOAA's Atmospheric Turbulence and Diffusion Division uses turbulence data to study transport and diffusion in the atmospheric boundary layer
How OSI Can Help Monitor Atmospheric Turbulence
Optical Scientific, Inc. (OSI) has developed and manufactured optical scintillation-based sensors since 1985, with deployments across aviation, transportation, energy, and research sectors. Clients include NASA, NOAA, the FAA, the EPA, and multiple U.S. military branches.
OSI's primary turbulence monitoring instrument is the LOA-005 Long-baseline Optical Anemometer, which delivers continuous, path-averaged Cn² turbulence and crosswind measurements across distances from 100 meters to 10 km. It was purpose-built for long-duration, unattended operation in demanding field environments.
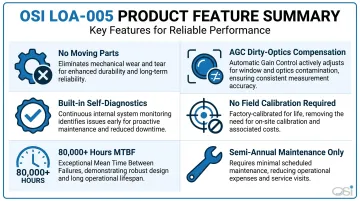
Key operational characteristics include:
- Eliminates the most common mechanical failure mode — no moving parts
- Maintains measurement accuracy despite dirty optics, dust, or LED power variation via AGC circuitry
- Monitors its own performance continuously through built-in self-diagnostics (24/7/365)
- Requires no field calibration — DSP-based design eliminates drift over time
- Exceeds 80,000 hours MTBF, roughly nine years of continuous operation before expected failure
- Requires only semi-annual maintenance: cleaning windows and checking alignment
For industrial applications in aluminum smelters, the LOA-105 provides the same scintillation-based measurement in a design rated for HF-resistant environments, with EPA Method 14 Equivalency Approval for airflow velocity measurement in roof vents.
OSI sensors support RS-232, RS-485, Ethernet, and cellular modem outputs for integration with:
- AWOS reporting systems at airports
- DOT RWIS networks for highway and transportation monitoring
- Industrial SCADA platforms for process control environments
The LOA technology has been tested and approved by NOAA, EPA, and ETL, and validated operationally through the NASA NASVOR program for airport wake vortex and turbulence monitoring. For organizations that need continuous, calibration-free turbulence data — whether on a runway, a highway corridor, or an industrial site — OSI's LOA series provides a direct solution backed by four decades of field-proven performance.
Frequently Asked Questions
What are the 4 levels of turbulence?
Aviation classifies turbulence as Light, Moderate, Severe, and Extreme. Light causes slight bumpiness with minimal control impact; Moderate makes walking difficult and may dislodge unsecured items; Severe produces large abrupt altitude changes and possible momentary loss of control; Extreme is rarely encountered but can impose structural stress on the airframe. Each level maps to a specific EDR range.
What is Eddy Dissipation Rate (EDR)?
EDR is the ICAO-standard metric for atmospheric turbulence intensity, expressed in units of m²/³ s⁻¹. It characterizes the air mass itself rather than an aircraft's response, so the same air produces the same EDR value regardless of aircraft type. That consistency makes EDR a reliable standard for cross-fleet operational decisions.
What is the difference between clear-air turbulence and regular turbulence?
Clear-air turbulence (CAT) occurs at altitude — typically above 15,000 ft — in cloud-free regions, most often associated with jet stream wind shear. It's particularly hazardous because it cannot be seen visually by pilots, and standard weather radar does not detect it, leaving flight crews with no warning.
How can I tell if my flight will be turbulent?
GTG forecasts and pilot route briefings draw on EDR-based forecast data to show expected turbulence intensity along a planned route. CAT remains the most difficult to anticipate — it can develop in areas that showed clear conditions in earlier forecasts, which is why continuous in-flight EDR reporting from aircraft is critical to operational awareness.
Can turbulence be measured on the ground?
Yes. Ground-based methods include NEXRAD NTDA radar (which measures in-cloud EDR), optical scintillation sensors (which measure Cn² turbulence along a surface-level optical path), and sonic anemometers. These tools are deployed at airports, along highways, and at research and industrial facilities for continuous turbulence monitoring.